LOL, Global warming scientists, trapped by thick ice.

Are you saying that chart is based on raw unadjusted numbers? If so then you are a pathetic liar.

My chart, which is the exact same chart the deniers use to claim there has been no warming for 17 years, is based on anomalies. Nobody uses raw unadjusted numbers, nobody with a working brain that is.

Lol, so now science cant use raw data, they all have to cook it first?

roflmao

Yes, you dumbass liar, lots of scientists still use raw data.

lol, you just cant make this shit up!

Hey :asshole:

We are talking about temperature measurements. Since you know you made a fool of yourself, you are trying to move the goalposts to ALL science.

Global temperature measurements use ANOMALIES, not raw data. Not all thermometers are perfectly accurate around the globe and as the deniers have pointed out, not all sites are ideal. So what scientists do is take that raw temperature data and average it over a 30 year period and then calculate the deviation of the raw data from that average. That deviation is an ANOMALY and that calculated data is more accurate in showing a warming or cooling trend than the raw data, which is why real scientists use ANOMALIES rather than raw dats only idiot deniers use because accurate data exposes the denier's lies.
 
My chart, which is the exact same chart the deniers use to claim there has been no warming for 17 years, is based on anomalies. Nobody uses raw unadjusted numbers, nobody with a working brain that is.

Lol, so now science cant use raw data, they all have to cook it first?

roflmao

Yes, you dumbass liar, lots of scientists still use raw data.

lol, you just cant make this shit up!

Your are clearly and idiot.

Hilarious.

Right out of the box, it's obvious that no one except you said that "science can't use raw data."

Where did I say that? Got a link? If not then you are just lying.
 
Yes, Greenland is the largest island on the planet, dude

You ever heard of Australia?

What is your point, Sherlock?

and a subject of constant harping by Warmistas about how much of it is melting.

Indeed, but how much of the Arctic ice is situated on Greenland? Try to stay focused here. Go take out a map and estimate the percentage of ice situated on land in the Arctic and tell me with a straight face that the majority is not sitting in the ocean.

Lol, dumbass, there is more ice on Greenland than in the Arctic ice cap at sea because the Greenland sheet is huge thick, like 2-3km thick, top to bottom.

This is hilarious, the way you morons display your ignorance about basic science and geography..
 
My chart, which is the exact same chart the deniers use to claim there has been no warming for 17 years, is based on anomalies. Nobody uses raw unadjusted numbers, nobody with a working brain that is.

Lol, so now science cant use raw data, they all have to cook it first?

roflmao

Yes, you dumbass liar, lots of scientists still use raw data.

lol, you just cant make this shit up!

Hey :asshole:

We are talking about temperature measurements. Since you know you made a fool of yourself, you are trying to move the goalposts to ALL science.

Global temperature measurements use ANOMALIES, not raw data. Not all thermometers are perfectly accurate around the globe and as the deniers have pointed out, not all sites are ideal. So what scientists do is take that raw temperature data and average it over a 30 year period and then calculate the deviation of the raw data from that average. That deviation is an ANOMALY and that calculated data is more accurate in showing a warming or cooling trend than the raw data, which is why real scientists use ANOMALIES rather than raw dats only idiot deniers use because accurate data exposes the denier's lies.

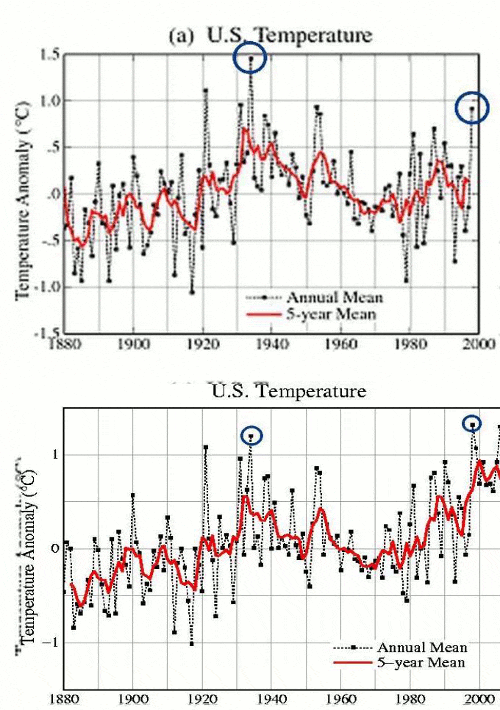
Before they do any of that, they 'adjust' the raw data prior to calculating the anomaly, dude. GIGO is what takes over after that. And whether they use 'anomalies' or straight temperature measurements in their displays is irrelevant, since the average is easily deducted or added, sheesh.

Do you guys even read your own AGW literature? That is where I got most of this stuff from.

roflmao
 
Lol, so now science cant use raw data, they all have to cook it first?

roflmao

Yes, you dumbass liar, lots of scientists still use raw data.

lol, you just cant make this shit up!

Hey :asshole:

We are talking about temperature measurements. Since you know you made a fool of yourself, you are trying to move the goalposts to ALL science.

Global temperature measurements use ANOMALIES, not raw data. Not all thermometers are perfectly accurate around the globe and as the deniers have pointed out, not all sites are ideal. So what scientists do is take that raw temperature data and average it over a 30 year period and then calculate the deviation of the raw data from that average. That deviation is an ANOMALY and that calculated data is more accurate in showing a warming or cooling trend than the raw data, which is why real scientists use ANOMALIES rather than raw dats only idiot deniers use because accurate data exposes the denier's lies.
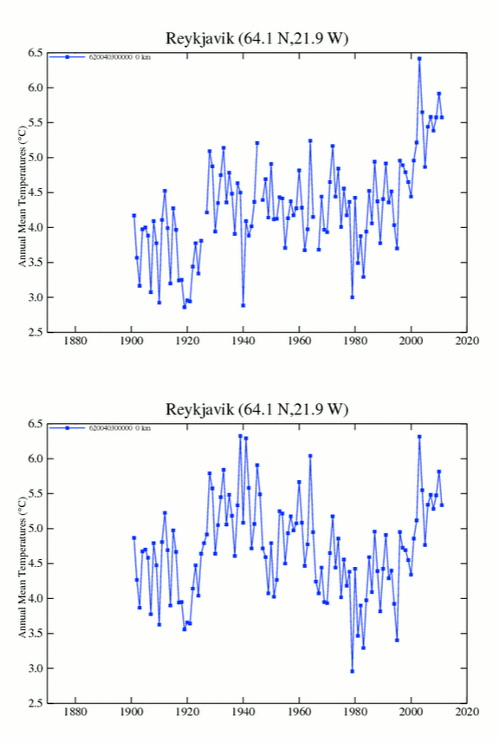
Before they do any of that, they 'adjust' the raw data prior to calculating the anomaly, dude. GIGO is what takes over after that. And whether they use 'anomalies' or straight temperature measurements in their displays is irrelevant, since the average is easily deducted or added, sheesh.

Do you guys even read your own AGW literature? That is where I got most of this stuff from.

roflmao

Liar!
 
Yes, Greenland is the largest island on the planet, dude

You ever heard of Australia?

What is your point, Sherlock?

Mostly that you were wrong.


The amount of Antarctic ice sitting on top of Antarctica dwarfs the ice sheet on Greenland, and the amount of floating ice in the Arctic is much higher than in the Antarctic. The fact that you can't recognize this speaks volumes to your willing ignorance. But, that is already shown by your ability to ignore shrinking ice in the Arctic but cling to growing ice in the Antarctic.


Moreover, you haven't even refuted the original point, which is that melting ice alters salinity and freezing temperature in the Antarctic. If this is true, then regardless of whether your points about Greenland were correct or not (they're not), we would still expect a growing ice sheet for a time in the Antarctic.
 
Last edited:
Right out of the box, it's obvious that no one except you said that "science can't use raw data."

Where did I say that? Got a link? If not then you are just lying.


Lol, so now science cant use raw data, they all have to cook it first?

Using strawmen is not a valid tactic to win an argument. You were the only one who stated that "science can't use raw data," a misrepresentation of a chart that uses temperature anomalies rather than absolute temperature.
 
MSM Glosses Over Irony of Global Warming Scientists Trapped in Antarctic Ice | NewsBusters

Somewhere far, far to the south where it is summer, a group of global warming scientists are trapped in the Antarctic ice. If you missed the irony of that situation, it is because much of the mainstream media has glossed over that rather inconvenient bit of hilarity. ...


The expedition is being led by Chris Turney, “climate scientist”, who has “set up a carbon refining company called Carbonscape which has developed technology to fix carbon from the atmosphere and make a host of green bi-products, helping reduce greenhouse gas levels.” The purpose of the expedition is “to discover and communicate the environmental changes taking place in the south.”

It seems they found out what the “environmental changes taking place in the south.” are.

Finally, National Geographic bluntly states the mission purpose:

...The current crop of explorers are hoping to document some of the same data and compare them to Mawson's numbers, "using the twist of modern technology," Turney told National Geographic earlier this month.

As may be expected, global warming might play a role in this, he suggests, particularly with respect to melted ice in the East Antarctic.

So some global warming scientists in Antarctica in the summer time get trapped in ice while trying to prove global warming.....roflmao

One cold winter and you nuts think you have proof that temperatures are dropping. LMAO!!!!!!

While we are having a decent cold spell, guess what is happening in the southern hemisphere?

Record heat wave takes down Argentina power grid – Mayor declares ‘state of emergency’ in Buenos Aires

Record heat wave takes down Argentina power grid ? Mayor declares ?state of emergency? in Buenos Aires
 
Yes, Greenland is the largest island on the planet, dude

You ever heard of Australia?

and a subject of constant harping by Warmistas about how much of it is melting.

Indeed, but how much of the Arctic ice is situated on Greenland? Try to stay focused here. Go take out a map and estimate the percentage of ice situated on land in the Arctic and tell me with a straight face that the majority is not sitting in the ocean.

Umm Australia is a continent.

Update. The dumbasses who are trying to save the dumbasses who were trying to save the dumbasses are being hampered by ice and weather.
 
Hey :asshole:

We are talking about temperature measurements. Since you know you made a fool of yourself, you are trying to move the goalposts to ALL science.

Global temperature measurements use ANOMALIES, not raw data. Not all thermometers are perfectly accurate around the globe and as the deniers have pointed out, not all sites are ideal. So what scientists do is take that raw temperature data and average it over a 30 year period and then calculate the deviation of the raw data from that average. That deviation is an ANOMALY and that calculated data is more accurate in showing a warming or cooling trend than the raw data, which is why real scientists use ANOMALIES rather than raw dats only idiot deniers use because accurate data exposes the denier's lies.

Before they do any of that, they 'adjust' the raw data prior to calculating the anomaly, dude. GIGO is what takes over after that. And whether they use 'anomalies' or straight temperature measurements in their displays is irrelevant, since the average is easily deducted or added, sheesh.

Do you guys even read your own AGW literature? That is where I got most of this stuff from.

roflmao

Liar!

Can you read, dumbass?

1998changesannotated-1.gif


iceland-1.gif


Climategate: The Smoking Code | Watts Up With That?

Now, here is some actual proof that the CRU was deliberately tampering with their data. Unfortunately, for readability’s sake, this code was written in Interactive Data Language (IDL) and is a pain to go through.

NOTE: This is an actual snippet of code from the CRU contained in the source file: briffa_Sep98_d.pro

1;
2; Apply a VERY ARTIFICAL correction for decline!!
3;
4 yrloc=[1400,findgen(19)*5.+1904]
5 valadj=[0.,0.,0.,0.,0.,-0.1,-0.25,-0.3,0.,-0.1,0.3,0.8,1.2,1.7,2.5,2.6,2.6,2.6,2.6,2.6]*0.75 ; fudge factor
6 if n_elements(yrloc) ne n_elements(valadj) then message,'Oooops!'
7
8 yearlyadj=interpol(valadj,yrloc,timey)

So the fudge factor is adjusting each year by their calendar year starting with 1904, in five year increments. Note that starting in 1930 the function arbitrarily subtracts 0.1 degrees, then in 1936 it removes 0.25, etc. Then in 1955 it begins to ADD temperature adjustments beginning with 0.3, etc.
 
MSM Glosses Over Irony of Global Warming Scientists Trapped in Antarctic Ice | NewsBusters

Somewhere far, far to the south where it is summer, a group of global warming scientists are trapped in the Antarctic ice. If you missed the irony of that situation, it is because much of the mainstream media has glossed over that rather inconvenient bit of hilarity. ...


The expedition is being led by Chris Turney, “climate scientist”, who has “set up a carbon refining company called Carbonscape which has developed technology to fix carbon from the atmosphere and make a host of green bi-products, helping reduce greenhouse gas levels.” The purpose of the expedition is “to discover and communicate the environmental changes taking place in the south.”

It seems they found out what the “environmental changes taking place in the south.” are.

Finally, National Geographic bluntly states the mission purpose:

...The current crop of explorers are hoping to document some of the same data and compare them to Mawson's numbers, "using the twist of modern technology," Turney told National Geographic earlier this month.

As may be expected, global warming might play a role in this, he suggests, particularly with respect to melted ice in the East Antarctic.

So some global warming scientists in Antarctica in the summer time get trapped in ice while trying to prove global warming.....roflmao

One cold winter and you nuts think you have proof that temperatures are dropping. LMAO!!!!!!

While we are having a decent cold spell, guess what is happening in the southern hemisphere?

Record heat wave takes down Argentina power grid – Mayor declares ‘state of emergency’ in Buenos Aires

Record heat wave takes down Argentina power grid ? Mayor declares ?state of emergency? in Buenos Aires

roflmao

1998changesannotated-1.gif


iceland-1.gif


Climategate: The Smoking Code | Watts Up With That?

Now, here is some actual proof that the CRU was deliberately tampering with their data. Unfortunately, for readability’s sake, this code was written in Interactive Data Language (IDL) and is a pain to go through.

NOTE: This is an actual snippet of code from the CRU contained in the source file: briffa_Sep98_d.pro

1;
2; Apply a VERY ARTIFICAL correction for decline!!
3;
4 yrloc=[1400,findgen(19)*5.+1904]
5 valadj=[0.,0.,0.,0.,0.,-0.1,-0.25,-0.3,0.,-0.1,0.3,0.8,1.2,1.7,2.5,2.6,2.6,2.6,2.6,2.6]*0.75 ; fudge factor
6 if n_elements(yrloc) ne n_elements(valadj) then message,'Oooops!'
7
8 yearlyadj=interpol(valadj,yrloc,timey)

So the fudge factor is adjusting each year by their calendar year starting with 1904, in five year increments. Note that starting in 1930 the function arbitrarily subtracts 0.1 degrees, then in 1936 it removes 0.25, etc. Then in 1955 it begins to ADD temperature adjustments beginning with 0.3, etc.
 
Before they do any of that, they 'adjust' the raw data prior to calculating the anomaly, dude. GIGO is what takes over after that. And whether they use 'anomalies' or straight temperature measurements in their displays is irrelevant, since the average is easily deducted or added, sheesh.

Do you guys even read your own AGW literature? That is where I got most of this stuff from.

roflmao

Liar!

Can you read, dumbass?

1998changesannotated-1.gif


iceland-1.gif


Climategate: The Smoking Code | Watts Up With That?

Now, here is some actual proof that the CRU was deliberately tampering with their data. Unfortunately, for readability’s sake, this code was written in Interactive Data Language (IDL) and is a pain to go through.

NOTE: This is an actual snippet of code from the CRU contained in the source file: briffa_Sep98_d.pro

1;
2; Apply a VERY ARTIFICAL correction for decline!!
3;

4 yrloc=[1400,findgen(19)*5.+1904]
5 valadj=[0.,0.,0.,0.,0.,-0.1,-0.25,-0.3,0.,-0.1,0.3,0.8,1.2,1.7,2.5,2.6,2.6,2.6,2.6,2.6]*0.75 ; fudge factor
6 if n_elements(yrloc) ne n_elements(valadj) then message,'Oooops!'
7
8 yearlyadj=interpol(valadj,yrloc,timey)

So the fudge factor is adjusting each year by their calendar year starting with 1904, in five year increments. Note that starting in 1930 the function arbitrarily subtracts 0.1 degrees, then in 1936 it removes 0.25, etc. Then in 1955 it begins to ADD temperature adjustments beginning with 0.3, etc.

Yeah, I can read. I see the semicolons! A semicolon in Fortran indicates that the line has been commented out, so it is ignored by the computer as the program runs. Neither yearlyadj or valadj are ever called by live code, so they play no part in plotting the graph. Fudgefactor is a redundant remnant, isolated and ignored by the running program.

YOU'VE BEEN HAD YET AGAIN!!!! Your deceivers know you don't understand code!!!
 
MSM Glosses Over Irony of Global Warming Scientists Trapped in Antarctic Ice | NewsBusters

Somewhere far, far to the south where it is summer, a group of global warming scientists are trapped in the Antarctic ice. If you missed the irony of that situation, it is because much of the mainstream media has glossed over that rather inconvenient bit of hilarity. ...


The expedition is being led by Chris Turney, “climate scientist”, who has “set up a carbon refining company called Carbonscape which has developed technology to fix carbon from the atmosphere and make a host of green bi-products, helping reduce greenhouse gas levels.” The purpose of the expedition is “to discover and communicate the environmental changes taking place in the south.”

It seems they found out what the “environmental changes taking place in the south.” are.

Finally, National Geographic bluntly states the mission purpose:

...The current crop of explorers are hoping to document some of the same data and compare them to Mawson's numbers, "using the twist of modern technology," Turney told National Geographic earlier this month.

As may be expected, global warming might play a role in this, he suggests, particularly with respect to melted ice in the East Antarctic.

So some global warming scientists in Antarctica in the summer time get trapped in ice while trying to prove global warming.....roflmao

One cold winter and you nuts think you have proof that temperatures are dropping. LMAO!!!!!!

While we are having a decent cold spell, guess what is happening in the southern hemisphere?

Record heat wave takes down Argentina power grid – Mayor declares ‘state of emergency’ in Buenos Aires

Record heat wave takes down Argentina power grid ? Mayor declares ?state of emergency? in Buenos Aires

from your link

coupled with greater industrial development and improved living standards continued to break power demand records and cause power outages.

that will be our future too if we listen to the KOOKs

and give up reliable energy for whimsy green energies
 

Can you read, dumbass?

1998changesannotated-1.gif


iceland-1.gif


Climategate: The Smoking Code | Watts Up With That?

Now, here is some actual proof that the CRU was deliberately tampering with their data. Unfortunately, for readability’s sake, this code was written in Interactive Data Language (IDL) and is a pain to go through.

NOTE: This is an actual snippet of code from the CRU contained in the source file: briffa_Sep98_d.pro

1;
2; Apply a VERY ARTIFICAL correction for decline!!
3;

4 yrloc=[1400,findgen(19)*5.+1904]
5 valadj=[0.,0.,0.,0.,0.,-0.1,-0.25,-0.3,0.,-0.1,0.3,0.8,1.2,1.7,2.5,2.6,2.6,2.6,2.6,2.6]*0.75 ; fudge factor
6 if n_elements(yrloc) ne n_elements(valadj) then message,'Oooops!'
7
8 yearlyadj=interpol(valadj,yrloc,timey)

So the fudge factor is adjusting each year by their calendar year starting with 1904, in five year increments. Note that starting in 1930 the function arbitrarily subtracts 0.1 degrees, then in 1936 it removes 0.25, etc. Then in 1955 it begins to ADD temperature adjustments beginning with 0.3, etc.

Yeah, I can read. I see the semicolons! A semicolon in Fortran indicates that the line has been commented out, so it is ignored by the computer as the program runs. Neither yearlyadj or valadj are ever called by live code, so they play no part in plotting the graph. Fudgefactor is a redundant remnant, isolated and ignored by the running program.

YOU'VE BEEN HAD YET AGAIN!!!! Your deceivers know you don't understand code!!!

lol, lines 4 through 8 are not commented out, dumbass
 
MSM Glosses Over Irony of Global Warming Scientists Trapped in Antarctic Ice | NewsBusters


So some global warming scientists in Antarctica in the summer time get trapped in ice while trying to prove global warming.....roflmao

One cold winter and you nuts think you have proof that temperatures are dropping. LMAO!!!!!!

While we are having a decent cold spell, guess what is happening in the southern hemisphere?

Record heat wave takes down Argentina power grid – Mayor declares ‘state of emergency’ in Buenos Aires

Record heat wave takes down Argentina power grid ? Mayor declares ?state of emergency? in Buenos Aires

from your link

coupled with greater industrial development and improved living standards continued to break power demand records and cause power outages.

that will be our future too if we listen to the KOOKs

and give up reliable energy for whimsy green energies

AGW fanatics don't give a rat's ass about the overall economy as long as their slice of the pie gets bigger.

then they might as well get used to rolling brown outs and days without power

to run the ac
 
Can you read, dumbass?

1998changesannotated-1.gif


iceland-1.gif


Climategate: The Smoking Code | Watts Up With That?


So the fudge factor is adjusting each year by their calendar year starting with 1904, in five year increments. Note that starting in 1930 the function arbitrarily subtracts 0.1 degrees, then in 1936 it removes 0.25, etc. Then in 1955 it begins to ADD temperature adjustments beginning with 0.3, etc.

Yeah, I can read. I see the semicolons! A semicolon in Fortran indicates that the line has been commented out, so it is ignored by the computer as the program runs. Neither yearlyadj or valadj are ever called by live code, so they play no part in plotting the graph. Fudgefactor is a redundant remnant, isolated and ignored by the running program.

YOU'VE BEEN HAD YET AGAIN!!!! Your deceivers know you don't understand code!!!

lol, lines 4 through 8 are not commented out, dumbass

That's because your dishonest source edited the semicolons out!
:asshole:

;
; Apply a VERY ARTIFICAL correction for decline!!
;
yrloc=[1400,findgen(19)*5.+1904]
valadj=[0.,0.,0.,0.,0.,-0.1,-0.25,-0.3,0.,-0.1,0.3,0.8,1.2,1.7,2.5,2.6,2.6,$
2.6,2.6,2.6]*0.75 ; fudge factor
if n_elements(yrloc) ne n_elements(valadj) then message,'Oooops!'
;
yearlyadj=interpol(valadj,yrloc,timey)
;

Dude, let me essplain this to you because you are making yourself look like an absolute idiot here, and I know you are not that stupid.
This is the code:
1;
2; Apply a VERY ARTIFICAL correction for decline!!
3;
4 yrloc=[1400,findgen(19)*5.+1904]
5 valadj=[0.,0.,0.,0.,0.,-0.1,-0.25,-0.3,0.,-0.1,0.3,0.8,1.2,1.7,2.5,2.6,2.6,2.6,2.6,2.6]*0.75 ; fudge factor
6 if n_elements(yrloc) ne n_elements(valadj) then message,'Oooops!'
7
8 yearlyadj=interpol(valadj,yrloc,timey)

The semicolons START the comment section on the line. The characters to the left of the semicolon are compiled code, unless another semicolon is left of them on the same line.

now look at the trext carefully and you might notice that lines 4-8 do not have semicolons on the left of the lines. See that?

roflmao
 
Last edited:
Indeed, warmer temperatures cause more ice in the antarctic because the ice in the antarctic is not floating in the ocean but resting on top of land. Melting ice changes the salinity in the water, causing a change in the freezing temperature. This doesn't happen in the northern hemisphere because the ice is already in the water and is made up of salt water already.

Does it make sense to simply ignore the reduction in ice in the north and focus on a flawed understanding of how Antarctic conditions work.

Thank you.

So the paper cited this? At what temperature level of the water does the fresh water freeze while salt water in that area does not, and what is the temperature of the water in those areas now?

I'm not grilling you, I'm trying to understand the prediction that was made and whether those conditions are indeed present down there now.
 
Gore, the high priest of AGW theory, has closed all of his Alliance for Climate Protection field offices, and laid off 90% of his staff. Contributions have all but dried up since 2008.


:lol::lol:
 

Forum List

Back
Top