In Figure 8, we compare our land reconstruction to the land reconstructions published by
the three other groups (results updated online, methods described by Brohan et al. 2006; Smith et
al. 2008; Hansen et al. 2010). Overall our global land average is similar to those obtained by
these prior efforts. There is some disagreement amongst the three groups, and our result is most
similar overall to NOAAs work.
The differences apparent in Figure 8 may partially reflect
difference in source data, but they probably primarily reflect differences in methodology.
The GHCN dataset used in the current analysis overlaps strongly with the data used by
other groups. The GHCN was developed by NOAA and is the sole source of the land-based
weather station data in their temperature reconstructions (but does not include the ocean data also
used in their global temperature analyses). In addition, GISS uses GHCN as the source for ~85%
of the time series in their analysis. The remaining 15% of GISS stations are almost exclusively
US and Antarctic sites that they have added / updated, and hence would be expected to have
somewhat limited impact due to their limited geographic coverage. HadCRU maintains a separate data set from GHCN for their climate analysis work though approximately 60% of the
GHCN stations also appear in HadCRU.
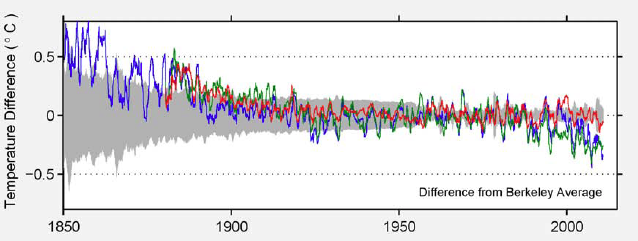
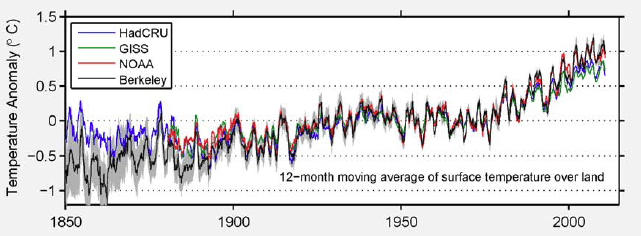
Figure 8. Comparison of the Berkeley Average to existing land-only averages reported by the
three major temperature groups. The upper panel shows 12-month moving averages for the four
reconstructions, and a gray band corresponding to the 95% uncertainty range on the Berkeley
average. The lower panel shows each of the prior averages minus the Berkeley average, as well
as the Berkeley average uncertainty.
As noted in the text, there is a much larger disagreement
among the existing groups when considering land-only data than when comparing the global
averages. HadCRU and GISS have systematically lower trends than Berkeley and NOAA. In
part, this is likely to reflect differences in how land-only has been defined by the three groups.
Berkeley is very similar to the NOAA result during the twentieth century and slightly lower than
all three groups during the 19th century.
The GISS and HadCRU work produce lower land-average temperature trends for the late
part of the 20th century. In this regard, our analysis suggests a degree of global land-surface
warming during the anthropogenic era that is consistent with prior work (e.g. NOAA) but on the
high end of the existing range of reconstructions. We note that the difference in land average
trends amongst the prior groups has not generally been discussed in the literature. In part, the
spread in existing land-only records may have received little attention because the three groups
have greater agreement when considering global averages that include oceans (Figure 1). We
strongly suspect that some of the difference in land-only averages is an artifact of the different
approaches to defining land-only temperature analyses. Our analysis and that produced by
NOAA explicitly construct an average that only considers temperature values over land.
However, that is not the only possible approach. The literature suggests that the GISS land-
only data product may be generated by measuring the global temperature fields using only
data reported over land. In this scenario temperature records in coastal regions and on islands
would be extrapolated over the oceans to create a global field using only land data. Whether or
not this approach was actually used is unclear from the literature, but it would result in an
overweighting of coastal and oceanic stations. This would in turn lead to a reduction in the
calculated land trend in a way that is qualitatively consistent with the difference observed in
Figure 8.
Though we are similar to NOAA for most of the 20th century, we note that we have
somewhat lower average temperatures during the period 1880-1930. This gives us a slightly
larger overall trend for the 20th century than any of the three groups. Most of that difference
comes from the more uncertain early period. In previous work, it has been argued that
instrumentation changes may have led to an artificial warm bias in the early 1900s (Folland et al.
2001, Parker 1994).
To the degree that our reconstruction from that era is systematically lower
than prior work (Figure 8), it could be that our methods are more resistant to biases due to those
instrumental changes.