Is "Climate Change" The Biggest Hoax Ever Perpetrated Against The American People?

Status
Not open for further replies.
My main complaint is that modelers are either deceptive about, or unaware of, the uncertainties in the myriad assumptions — both explicit and implicit — that have gone into those models.
[assumed to be by Roy Spencer] ...

They are not deceptive in the scientific media, where they have to explain the uncertainties and say how the researches dealt with them, or they don't get published ...

Certainly some researches have been deceptive to the commercial media, MSM will pay for interviews ... also, there's no space or time to go over all the assumptions in an 18 second TV blerp ... we have to have our own knowledge about these systems and how computers are programmed to simulate these trends ...

"Measuring Earth's Albedo" isn't as easy as you think ... pretty damn weasel to say "about 0.30" ... even if correct, this only gives us temperature to the nearest whole degree ... so much for those "one degree catastrophes" ...
 
The right’s war on facts, science, and the truth continues – conservatives seek to drag America into a Dark Age of fear and ignorance.

You need to catch up with the data:

I prefer hard evidence over MSM error filled propaganda.

Climate/weather related deaths plummeted over 100 years' time:

global-climate-deaths-per-mil-mine-square.png


LINK

===

Many charts in the link from official sources.
 
You need to catch up with the data:

I prefer hard evidence over MSM error filled propaganda.

Climate/weather related deaths plummeted over 100 years' time:

global-climate-deaths-per-mil-mine-square.png


LINK

===

Many charts in the link from official sources.
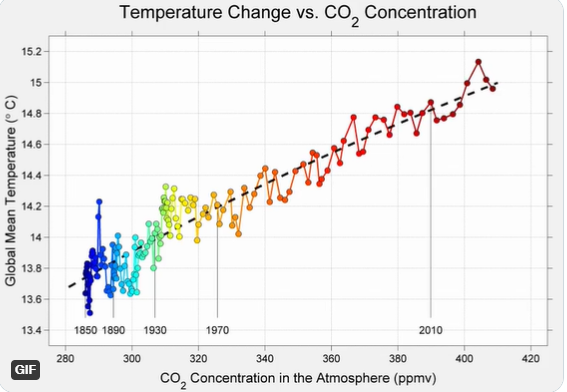
Than you prefer this:

Figure-2-1.png

 
Last edited:
Why do you think log2 (0.0004) = 8.5? ... or are you just being a stupid motherfucker ... I come up with -7.8 ... that's negative 7.8 ... stupid motherfucker ...
 
Than you prefer this:

Figure-2-1.png


:laugh:

You didn't address any of what I posted at all at POST 729

What were you trying to counter?

Meanwhile from YOUR link,

Conclusion
I’m not impressed with Rohde’s display. The coefficient of correlation is decent, but it does not show that warming is controlled by changes in CO2, the temperature reversals are not explained. The reversals strongly suggest that natural forces are playing a significant role in the warming and can reverse the influence of CO2. The plots show that, at most, CO2 explains about 50% of the warming, something else, like solar changes, must be causing the reversals. If they can reverse the CO2-based warming and overwhelm the influence of CO2 they are just as strong.

Meanwhile you left out a few things that clarifies the chart YOU posted:

Figure 2. The orange line is the log2CO2, use the right-hand scale. The multicolored line is the HadCRUT5 land + ocean global surface temperature record, it uses the left scale. The different colors identify the periods shown in the legend

In Figure 2 we can see that the relationship between CO2 and temperature is close to what we expect from 1980 to 2000, from 2000 to today, warming is a bit faster than we would predicing.t from the change in CO2. From 1850 to 1910 and 1944 to 1976 temperatures fall, but CO2 increases. From 1910 to 1944 temperatures rise much faster than can be explained by changes in the CO2 concentration. These anomalies suggest other forces are at work that are as strong as CO2-based warm

Stop being dishonest!
 
What makes you think they ignore water vapor?

The terms vapor, vapors, evaporative, evaporation appear 391 times in "Annex II: Models" of the Physical Science Basis. Dozens and dozens of models are explicitly described as taking water vapor, evaporation and latent heat of evaporation into account.

I ask again, where did you get the idea that models ignored water vapor?
because they do
 
Most climate models ... and perhap all climate models ... are based on SB, Earth's surface temperature is proportional to the fourth-root of irradiation ...

You claim the models themselves are flawed ... when in fact it is the human interpretation of these results that are flawed ... as you learned reading these citations before you posted links ...

`Garbage in, garbage out` only reflects on the researcher, not the model ...
I like this one I found.

 
Than you prefer this:

Figure-2-1.png

That only looks bad to you because you are comparing it to a cold spell. 8,500 of the past 10,000 years have been warmer than recent decades.
 
Dishonest? How much hand holding do you actually require?

Just as I expected you can't handle the official data sourced based charts I posted because it doesn't support your climate crisis delusions.

NOAA, JMA, EMDAT, BOM, UAH, National Hurricane Center

It remains unchallenged.
 
Just as I expected you can't handle the official data sourced based charts I posted because it doesn't support your climate crisis delusions.

NOAA, JMA, EMDAT, BOM, UAH, National Hurricane Center

It remains unchallenged.
Public

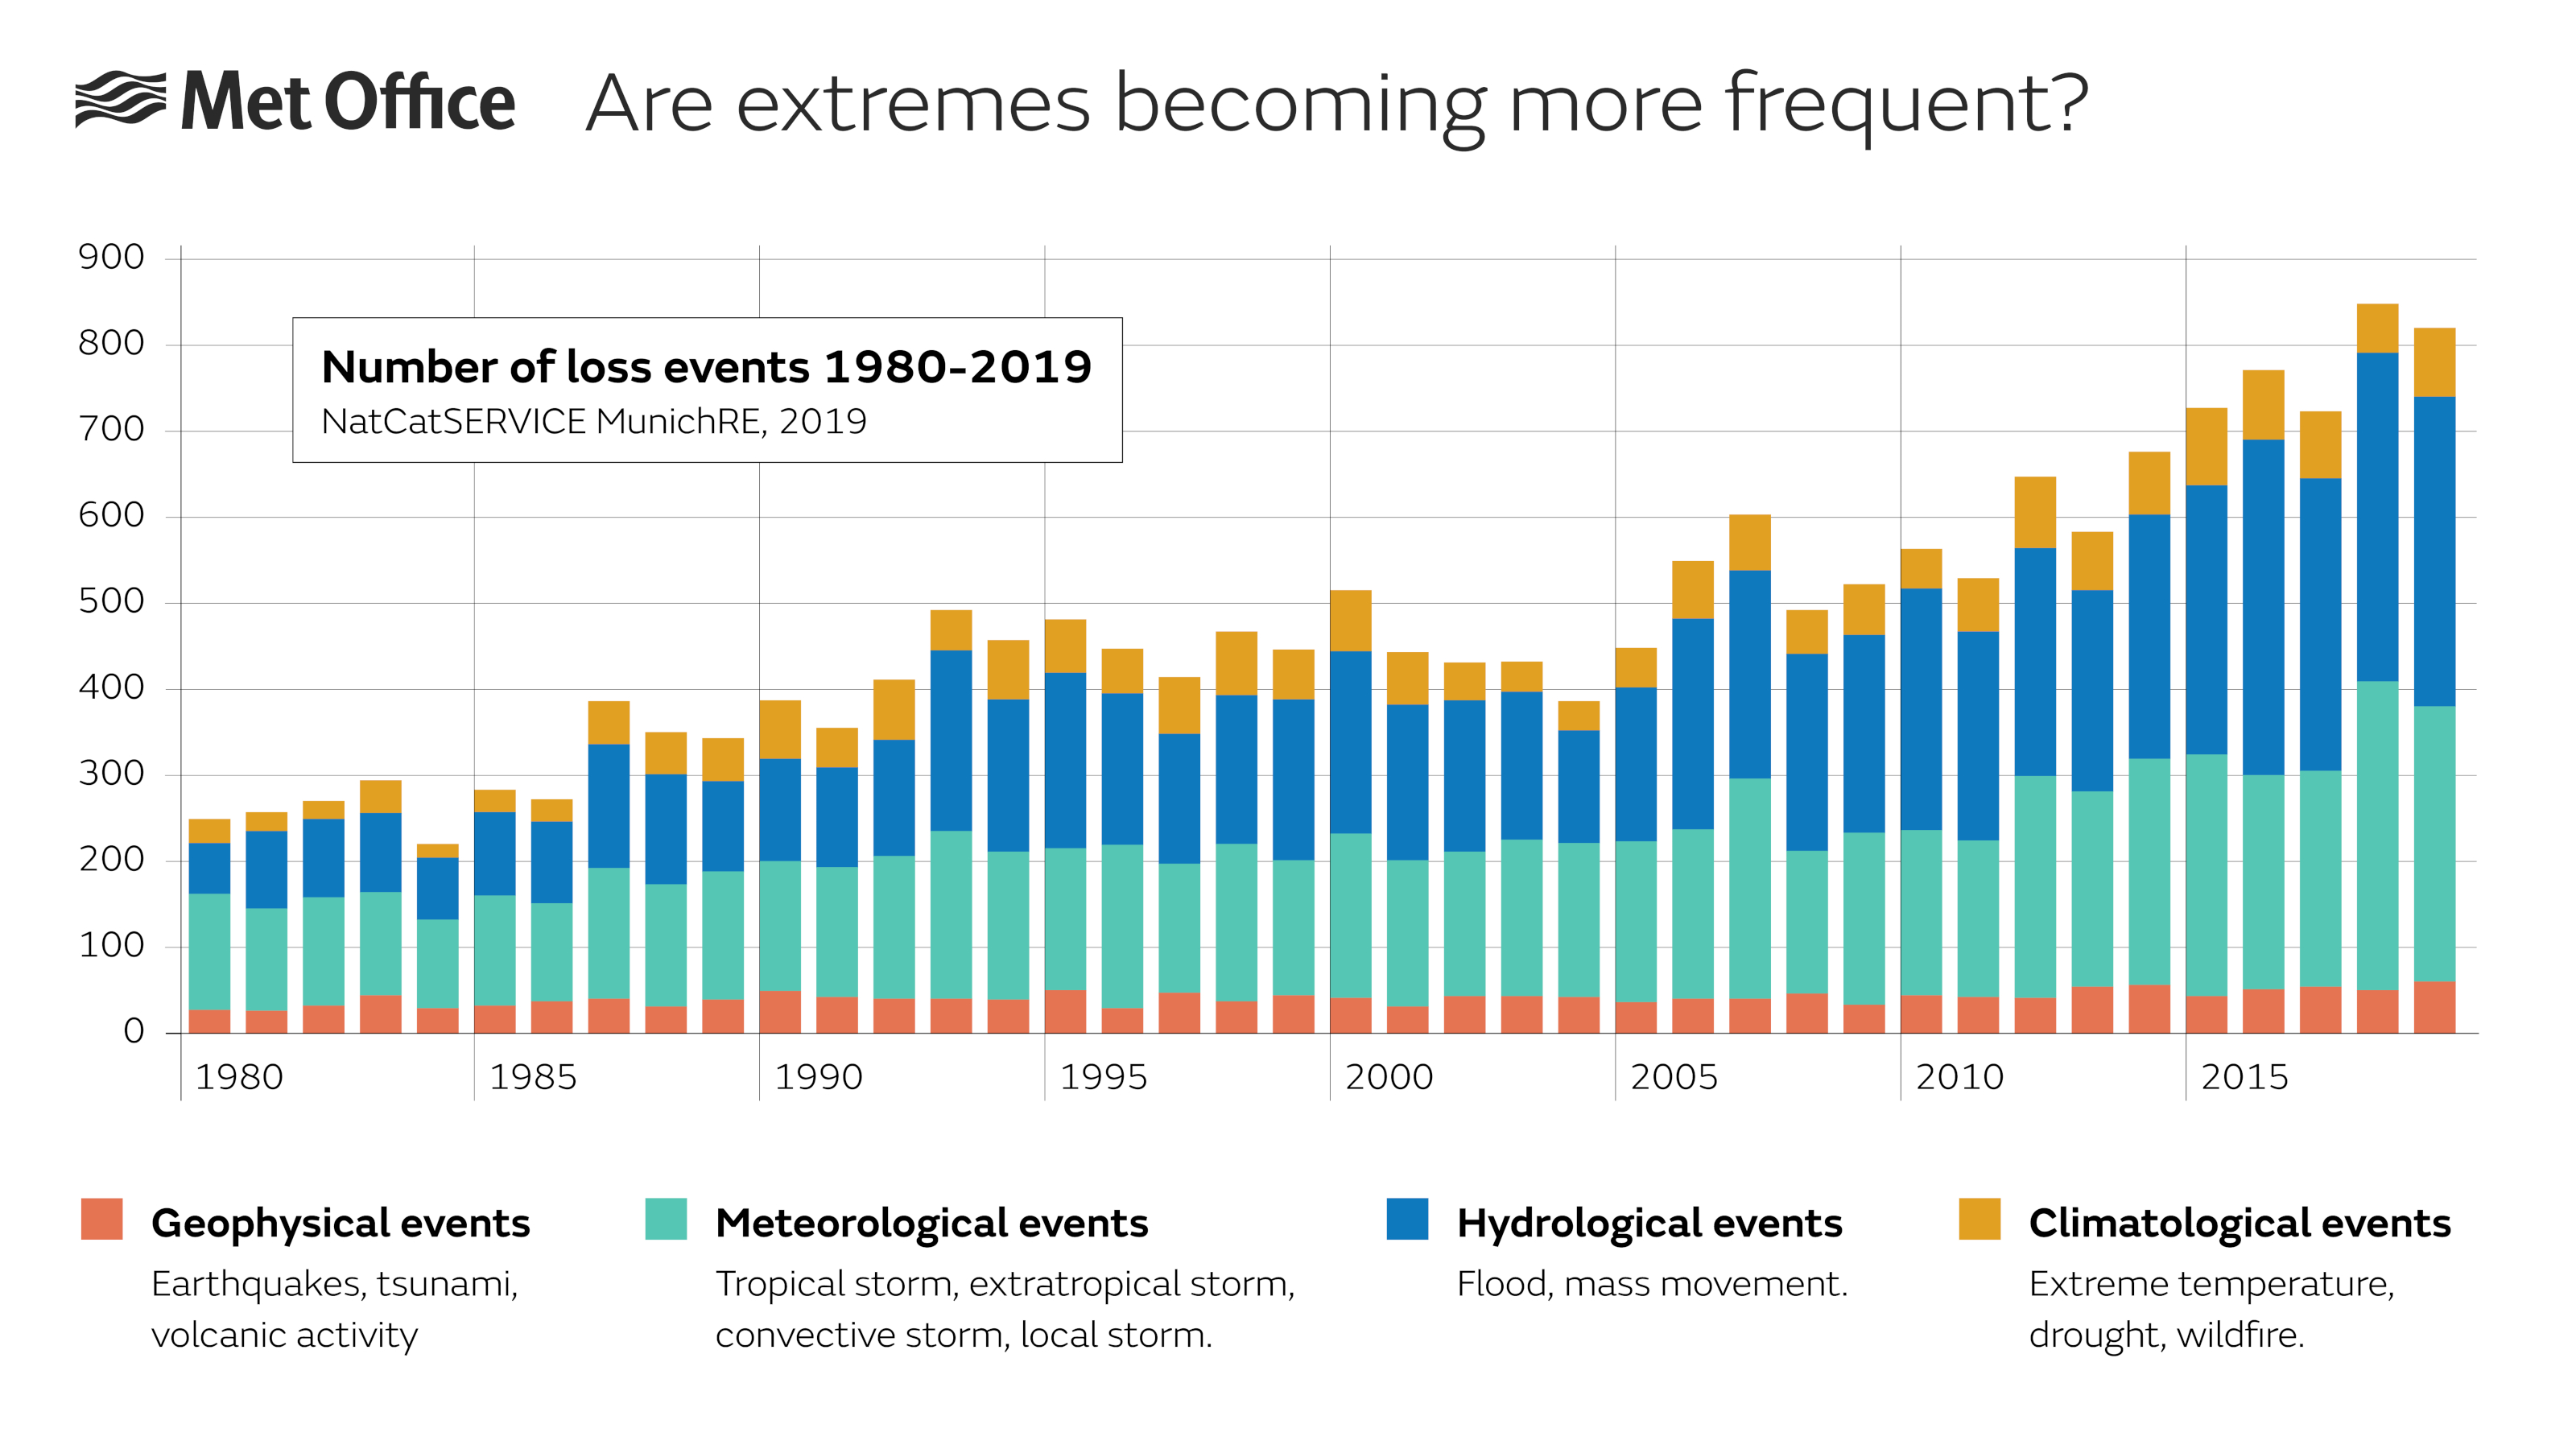
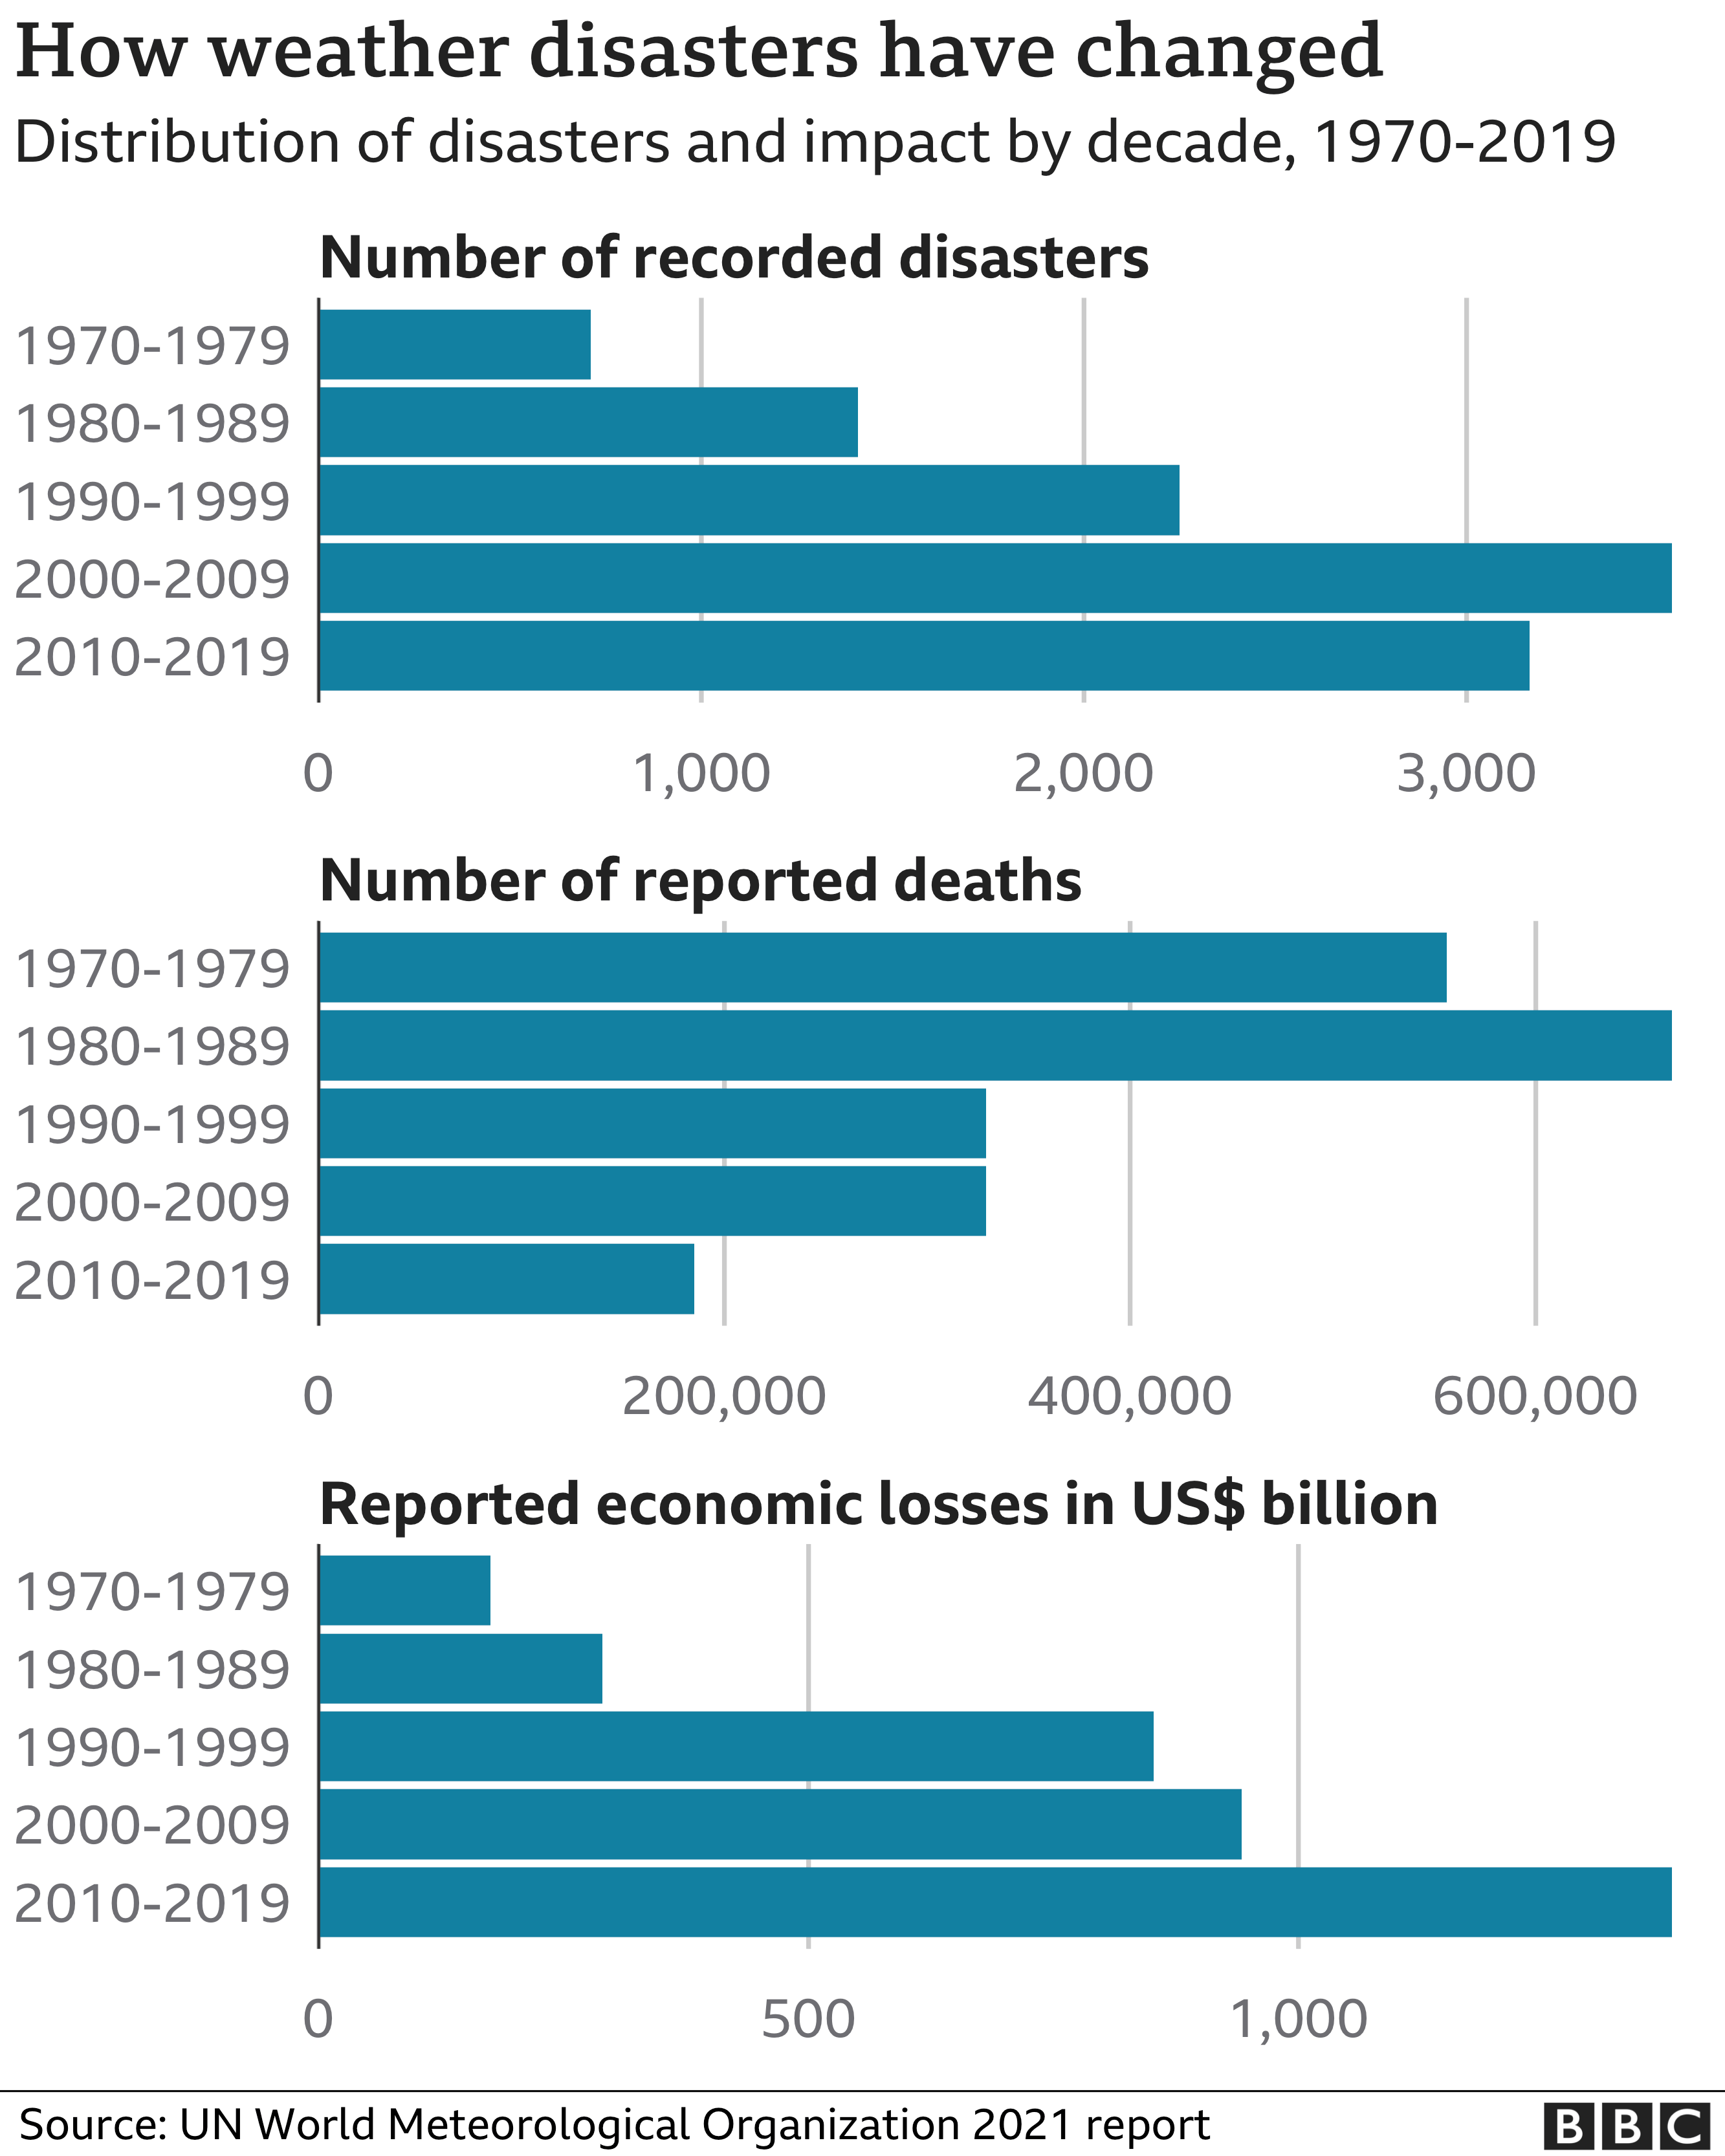
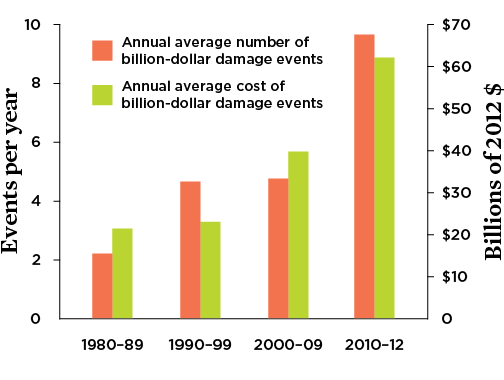
frequency-of-extremes-graph---1980-2019.jpg

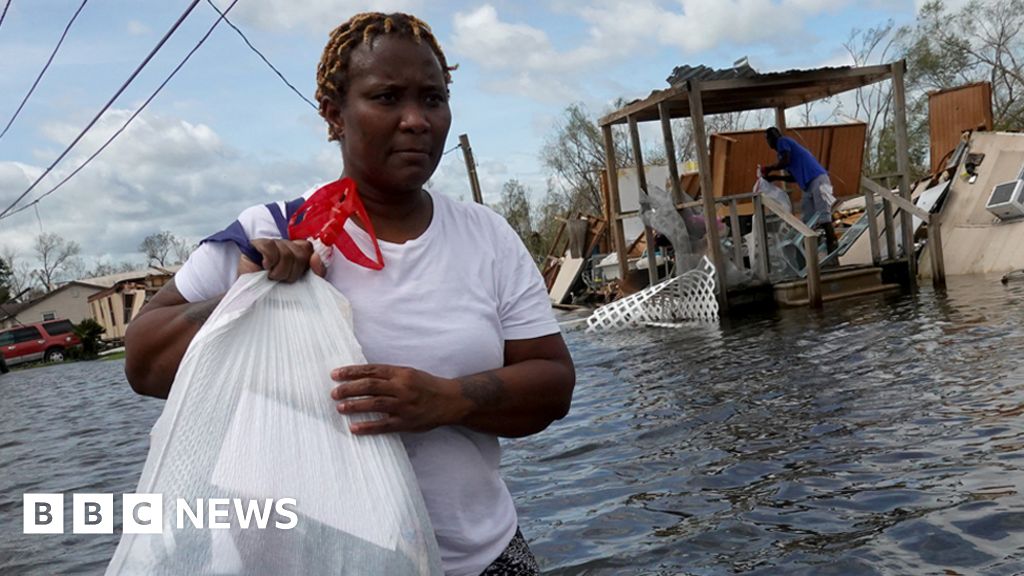
_120352831_optimised-disasters-nc.png

Extreme-weather-events-chart.png


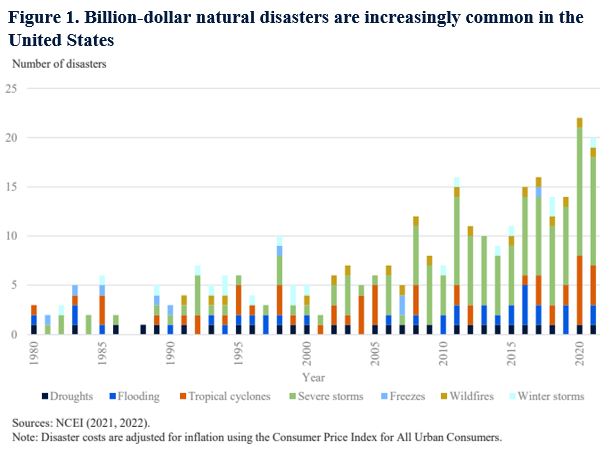
FIGURE-1-CLIMATE.jpg


Happy?
 
Public

frequency-of-extremes-graph---1980-2019.jpg

_120352831_optimised-disasters-nc.png

Extreme-weather-events-chart.png


FIGURE-1-CLIMATE.jpg


Happy?


The "new data" from 2018 is laughable. It is an outright lie because there were far more storms, and more powerful than any over the following 36 years that they hyperventilate about.

Classic cherry picking.
 
Public

frequency-of-extremes-graph---1980-2019.jpg

_120352831_optimised-disasters-nc.png

Extreme-weather-events-chart.png


FIGURE-1-CLIMATE.jpg


Happy?

Chart Wars ...ha ha ha ha ha ha ha ha ha ha ... no science, just charts ...
 
Chart Wars ...ha ha ha ha ha ha ha ha ha ha ... no science, just charts ...
You posted more charts than I did. You must have won. But, if you think charts are no good, we can start over again and discuss the actual science re the effect of rising air and sea temperatures on weather.
 
You posted more charts than I did. You must have won. But, if you think charts are no good, we can start over again and discuss the actual science re the effect of rising air and sea temperatures on weather.
When you do make sure to explain how the planet could have possibly cooled from a greenhouse state to an icehouse state with atmospheric CO2 greater than 1000 ppm if water vapor is a net positive feedback.
 
You posted more charts than I did. You must have won. But, if you think charts are no good, we can start over again and discuss the actual science re the effect of rising air and sea temperatures on weather.

"Rising global average temperature is associated with widespread changes in weather patterns. Scientific studies indicate that extreme weather events such as heat waves and large storms are likely to become more frequent or more intense with human-induced climate change"

Why does it matter?​

Long-term changes in climate can directly or indirectly affect many aspects of society in potentially disruptive ways. For example, warmer average temperatures could increase air conditioning costs and affect the spread of diseases like Lyme disease, but could also improve conditions for growing some crops. More extreme variations in weather are also a threat to society. More frequent and intense extreme heat events can increase illnesses and deaths, especially among vulnerable populations, and damage some crops. While increased precipitation can replenish water supplies and support agriculture, intense storms can damage property, cause loss of life and population displacement, and temporarily disrupt essential services such as transportation, telecommunications, energy, and water supplies.

Summary of Key Points​

  • U.S. and Global Temperature. Average temperatures have risen across the contiguous 48 states since 1901, with an increased rate of warming over the past 30 years. Nine of the top 10 warmest years on record have occurred since 1998. Average global temperatures show a similar trend, and all of the top 10 warmest years on record worldwide have occurred since 2005. Within the United States, temperatures in parts of the North, the West, and Alaska have increased the most.
  • Seasonal Temperature. As the Earth warms overall, average temperatures increase throughout the year, but the increases may be larger in certain seasons than in others. Since 1896, average winter temperatures across the contiguous 48 states have increased by nearly 3°F. Spring temperatures have increased by about 2°F, while summer and fall temperatures have increased by about 1.5°F.
  • High and Low Temperatures. Many extreme temperature conditions are becoming more common. Since the 1970s, unusually hot summer days (highs) have become more common over the last few decades in the United States. Unusually hot summer nights (lows) have become more common at an even faster rate. This trend indicates less “cooling off” at night. Although the United States has experienced many winters with unusually low temperatures, unusually cold winter temperatures have become less common—particularly very cold nights (lows). Record-setting daily high temperatures have become more common than record lows.
  • Heat Waves. Heat waves are occurring more than they used to in major cities across the United States. Heat waves are occurring three times more often than they did in the 1960s—about six per year compared with two per year. The average heat wave season is 49 days longer, and individual heat waves are lasting longer and becoming more intense.
  • U.S. and Global Precipitation. Total annual precipitation has increased over land areas in the United States and worldwide. Since 1901, precipitation has increased at an average rate of 0.2 inches per decade over the contiguous 48 states. However, shifting weather patterns have caused certain areas, such as the Southwest, to experience less precipitation than usual.
  • Heavy Precipitation. In recent years, a higher percentage of precipitation in the United States has come in the form of intense single-day events. The prevalence of extreme single-day precipitation events remained fairly steady between 1910 and the 1980s but has risen substantially since then. Nationwide, nine of the top 10 years for extreme one-day precipitation events have occurred since 1996. The occurrence of abnormally high annual precipitation totals (as defined by the National Oceanic and Atmospheric Administration) has also increased.
  • Tropical Cyclone Activity. Tropical storm activity in the Atlantic Ocean, the Caribbean, and the Gulf of Mexico has increased during the past 20 years. Storm intensity, a measure of strength, duration, and frequency, is closely related to variations in sea surface temperature in the tropical Atlantic and has risen noticeably during that time. However, changes in observation methods over time make it difficult to know for sure whether a longer-term increase in storm activity has occurred. Records collected since the late 1800s suggest that the actual number of hurricanes per year has not increased.
  • River Flooding. Increases and decreases in the frequency and magnitude of river flood events vary by region. Floods have generally become larger across parts of the Northeast and Midwest and smaller in the West, southern Appalachia, and northern Michigan. Large floods have become more frequent across the Northeast, Pacific Northwest, and parts of the northern Great Plains, and less frequent in the Southwest and the Rockies.
  • Drought. Average drought conditions across the nation have varied over time. The 1930s and 1950s saw the most widespread droughts, while the last 50 years have generally been wetter than average. Specific trends vary by region, as the West has generally experienced more drought while the Midwest and Northeast have become wetter. A more detailed index developed recently shows that over the period from 2000 through 2020, roughly 20 to 70 percent of the U.S. land area experienced conditions that were at least abnormally dry at any given time. However, this index has not been in use for long enough to compare with historical drought patterns.
  • A Closer Look: Temperature and Drought in the Southwest. The southwestern United States is particularly sensitive to changes in temperature and thus vulnerable to drought, as even a small decrease in water availability in this already arid region can stress natural systems and further threaten water supplies. Several measures indicate persistent and more severe drought conditions in recent years.
 
You posted more charts than I did. You must have won. But, if you think charts are no good, we can start over again and discuss the actual science re the effect of rising air and sea temperatures on weather.

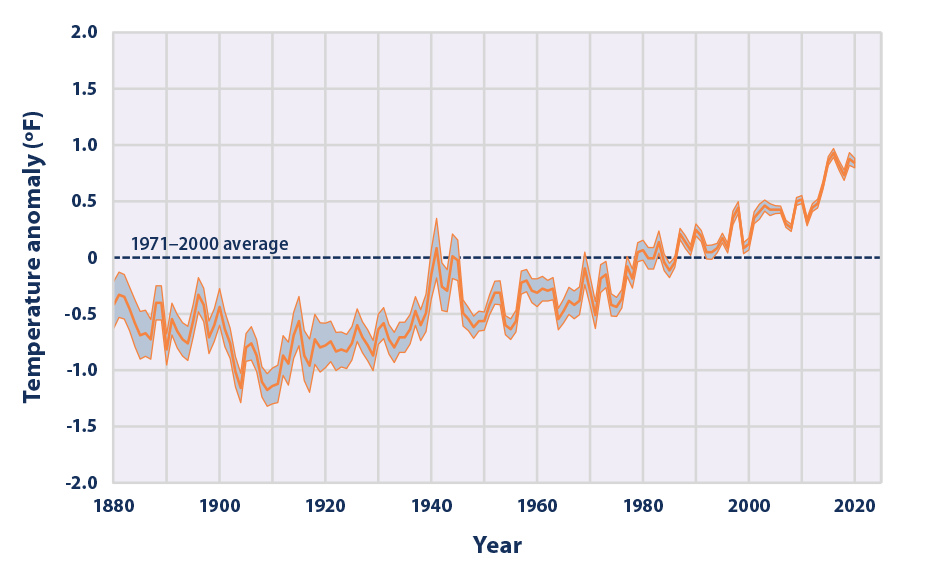
sea-surface-temp_figure1_2021.png

This graph shows how the average surface temperature of the world’s oceans has changed since 1880. This graph uses the 1971 to
2000 average as a baseline for depicting change. Choosing a different baseline period would not change the shape of the data over
time. The shaded band shows the range of uncertainty in the data, based on the number of measurements collected and the
precision of the methods used.

Data source: NOAA, 20217
Web update: April 2021
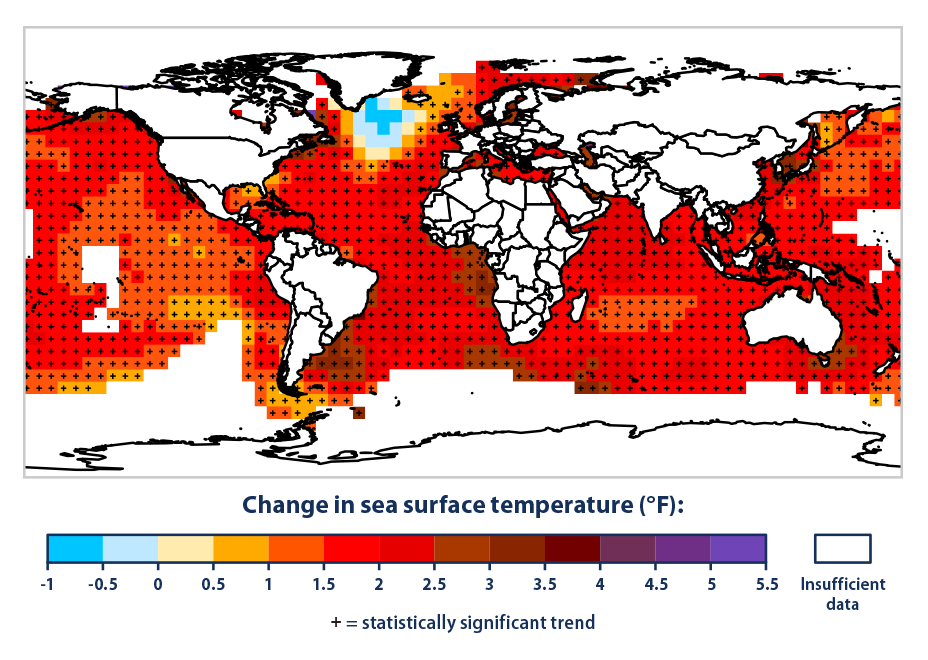
sea-surface-temp_figure2_2021.png

This map shows how average sea surface temperature around the world changed between 1901 and 2020. It is based on a combination
of direct measurements and satellite measurements. A black “+” symbol in the middle of a square on the map means the trend shown
is statistically significant. White areas did not have enough data to calculate reliable long-term trends.

Data source: IPCC, 2013;8 NOAA, 20219
Web update: April 2021


Because the oceans continuously interact with the atmosphere, sea surface temperature can also have profound effects on global climate. Increases in sea surface temperature have led to an increase in the amount of atmospheric water vapor over the oceans. This water vapor feeds weather systems that produce precipitation, increasing the risk of heavy rain and snow (see the Heavy Precipitation and Tropical Cyclone Activity indicators). Changes in sea surface temperature can shift storm tracks, potentially contributing to droughts in some areas. Increases in sea surface temperature are also expected to lengthen the growth season for certain bacteria that can contaminate seafood and cause foodborne illnesses, thereby increasing the risk of health effects.

Key Points​

  • Sea surface temperature increased during the 20th century and continues to rise. From 1901 through 2020, temperature rose at an average rate of 0.14°F per decade (see Figure 1).
  • Sea surface temperature has been consistently higher during the past three decades than at any other time since reliable observations began in 1880 (see Figure 1).
  • Based on the historical record, increases in sea surface temperature have largely occurred over two key periods: between 1910 and 1940, and from about 1970 to the present. Sea surface temperature appears to have cooled between 1880 and 1910 (see Figure 1).
  • Changes in sea surface temperature vary regionally. While most parts of the world’s oceans have seen temperature rise, a few areas have actually experienced cooling—for example, parts of the North Atlantic (see Figure 2).
 
Last edited:
The Scamdemic has to rate way up there....just for the intensity and immediate, willing and slavish response by those who were targetted for the deception.
 
The Scamdemic has to rate way up there....just for the intensity and immediate and slavish response by those who were targetted for the deception.
So, what killed my friends that died of COVID-19 infections?

Or the other million Americans who died of the disease?
 
Last edited:
Status
Not open for further replies.

Forum List

Back
Top