Growing Days..... Shorten again

When you aggregate weather over averaged over a long time and a region you wind up with "climate".

What is happening isn't "climate" or "climate change". It is a reoccurent irregular weather pattern that comes usually between every other to one in seven years. This is not the first nor will it be the last time that region gets whacked with a late spring because of LN.
 
What is happening isn't "climate" or "climate change". It is a reoccurent irregular weather pattern that comes usually between every other to one in seven years. This is not the first nor will it be the last time that region gets whacked with a late spring because of LN.
What do you believe to be a recurrent weather pattern? Global warming? Cooling? Growing days going one way or the other?
 
What do you believe to be a recurrent weather pattern? Global warming? Cooling? Growing days going one way or the other?

La Nina....the thing that is causing the late spring in Colorado and parts of the west where the growing days are "shortened"
 
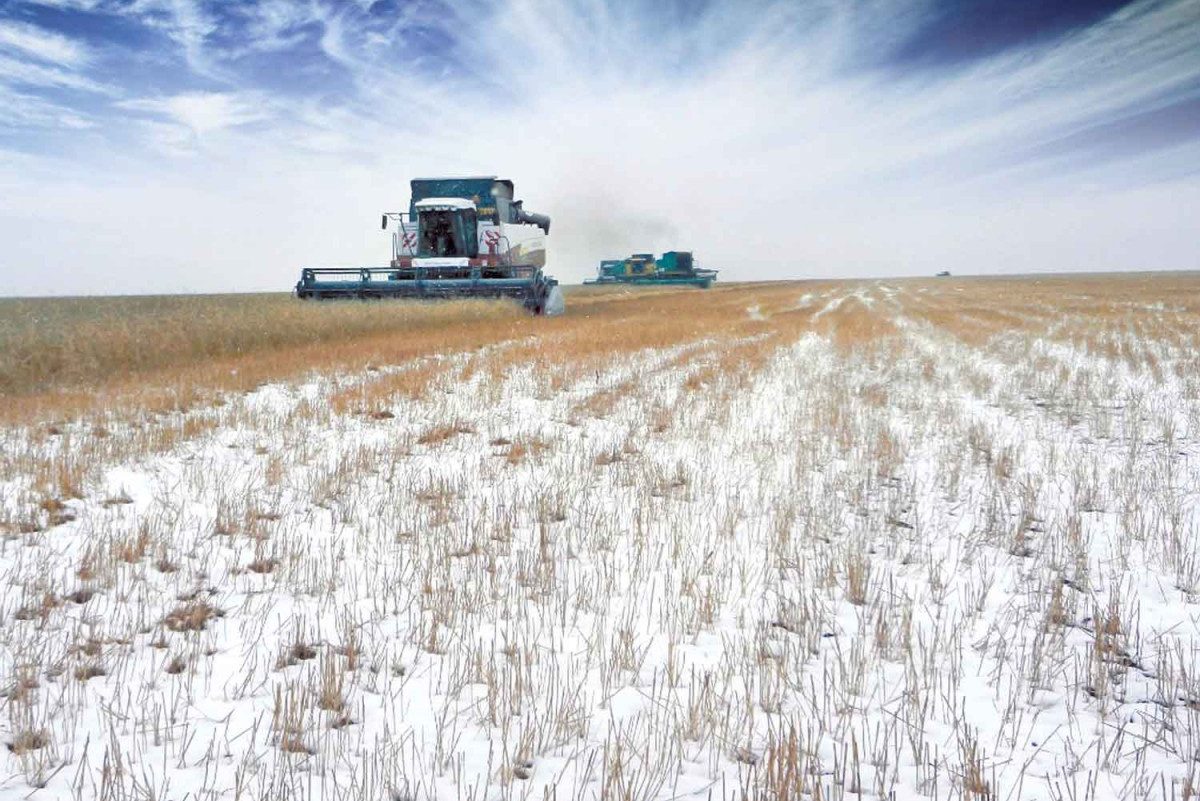
I guess this comes as no surprise to those of us who have been watching the global cooling trend for the last 11 years. Last year the growing season was shorter by 51 days from the 30-year average. This year were already at 57 days. The snow and cold continue coast to coast in the breadbasket states and farmlands.

One more problem to add to the self-inflicted shots to both feet by Biden and democrat AGW nuts. This means not only will costs for fuel and fertilizers to create food be an issue, but we also now have to worry that farmers will now only be able to get one planting and harvest this year. A reduction of output by half. You think food prices are high now, wait a month...

The potential for famine in the US is now likely, not to mention the third world will be seeing massive famine and deaths.
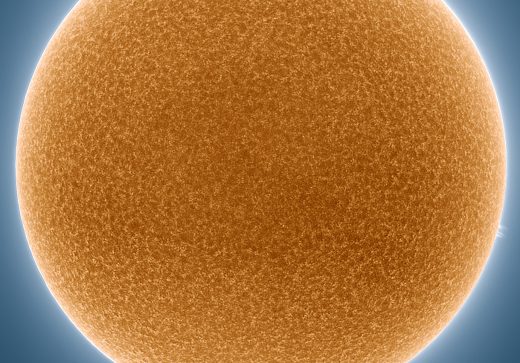

Last year the growing season was shorter by 51 days from the 30-year average.

Still no back up for your claim?

I hope your "paper" has more evidence.

Any idea of a publication date?

Still going through peer review?
 
And then there's this:

I imagine it is quite warm in urban areas with all that heat retaining concrete and waste heat from electricity use.

Of course it's also an interglacial cycle. And we are still a couple of degrees below previous interglacial cycles.
 
I imagine it is quite warm in urban areas with all that heat retaining concrete and waste heat from electricity use.

Of course it's also an interglacial cycle. And we are still a couple of degrees below previous interglacial cycles.
Not within the Holocene we aren't.
 
Not within the Holocene we aren't.
vegashitshispants is an idiot.gif
 
What is the source of this graphic? The rules in this forum required that you provide links for all data like this.

And while we're here, we've talked about this graphic before. The final CO2 value corresponds to at least May of 2013, the point at which CO2 first hit 400 ppm in several million years. CO2 is a well-mixed gas in the Earth's atmosphere so the values shown here are generally good for the entire globe. That is NOT true of the temperature which, since this is 800 kyr core data, is the temperature at Vostok Station Antarctica. And even that is irrelevant because you have not provided - likely because you do not know - what the zero on this graph might actually be. When I tried to look this up last week the best answer I could get was that it was the mean of the first 400,000 years of this ice core. So, no absolute value given and most certainly - since "before present" means "before 1950" - not the temperature of the Earth as a whole in May of 2013.

Did you not see this when I pointed out that problem to you last week? You have not challenged me on this. Are you knowingly and intentionally putting out bad data? Because, that's EXACTLY what it looks like.
 
Last edited:
What is the source of this graphic? The rules in this forum required that you provide links for all data like this.
It's one Abu Afuk used and I used against him. Here's one from John Englander.

Englander 420kyr CO2-T-SL rev.jpg
 
Let me try this again. GIVE US A WORKING LINK TO THE GRAPHIC IN POST #89.
You'll have to ask Abu. I accept it because I can find 100 more that show the exact same thing. I just provided one for you.
 
You'll have to ask Abu. I accept it because I can find 100 more that show the exact same thing. I just provided one for you.
I do not believe that satisfies the rules here. You do NOT know what temperatures that graph is displaying so you CAN NOT make ANY comparisons with ANY ACTUAL TEMPERATURES. When you do, you are flat out lying through your teeth.
 
I do not believe that satisfies the rules here. You do NOT know what temperatures that graph is displaying so you CAN NOT make ANY comparisons with ANY ACTUAL TEMPERATURES. When you do, you are flat out lying through your teeth.
You should be careful throwing stones. You live in a glass house.
 

Forum List

Back
Top