Correlation is not proof of causation. The geologic record is littered with warming and cooling trends that were not driven by CO2 or orbital forcing.CO2 is released from the oceans by warming. CO2 also produces warming through the greenhouse effect and Shakun 2012 clearly shows it. Your rejection of the greenhouse effect makes it impossible to believe you have any real science literacy.
Navigation
Install the app
How to install the app on iOS
Follow along with the video below to see how to install our site as a web app on your home screen.
Note: This feature may not be available in some browsers.
More options
Style variation
You are using an out of date browser. It may not display this or other websites correctly.
You should upgrade or use an alternative browser.
You should upgrade or use an alternative browser.
Growing Days..... Shorten again
- Thread starter Billy_Bob
- Start date
Since you refuse to read Shakun's study you have no right to make any comment whatsoever about it. And if you had any familiarity with actual science you'd know that no one depends solely on correlation to attribute causation. And if you had ever had the most basic course in logic you'd know that geologic record does not prove that CO2 can't be forcing the climate.Correlation is not proof of causation. The geologic record is littered with warming and cooling trends that were not driven by CO2 or orbital forcing.
Turtlesoup
Diamond Member
- Aug 10, 2020
- 15,903
- 16,745
- 2,288
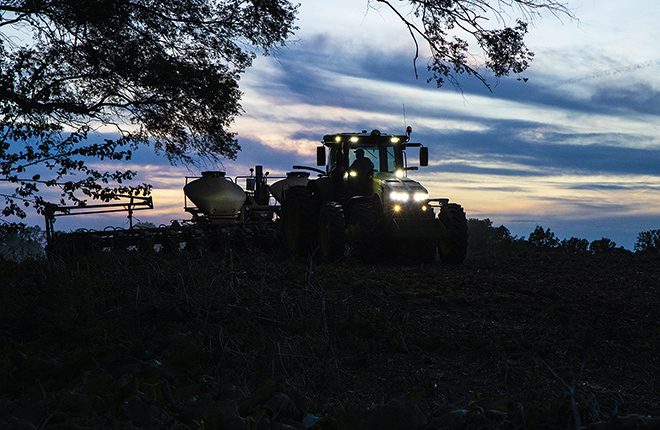
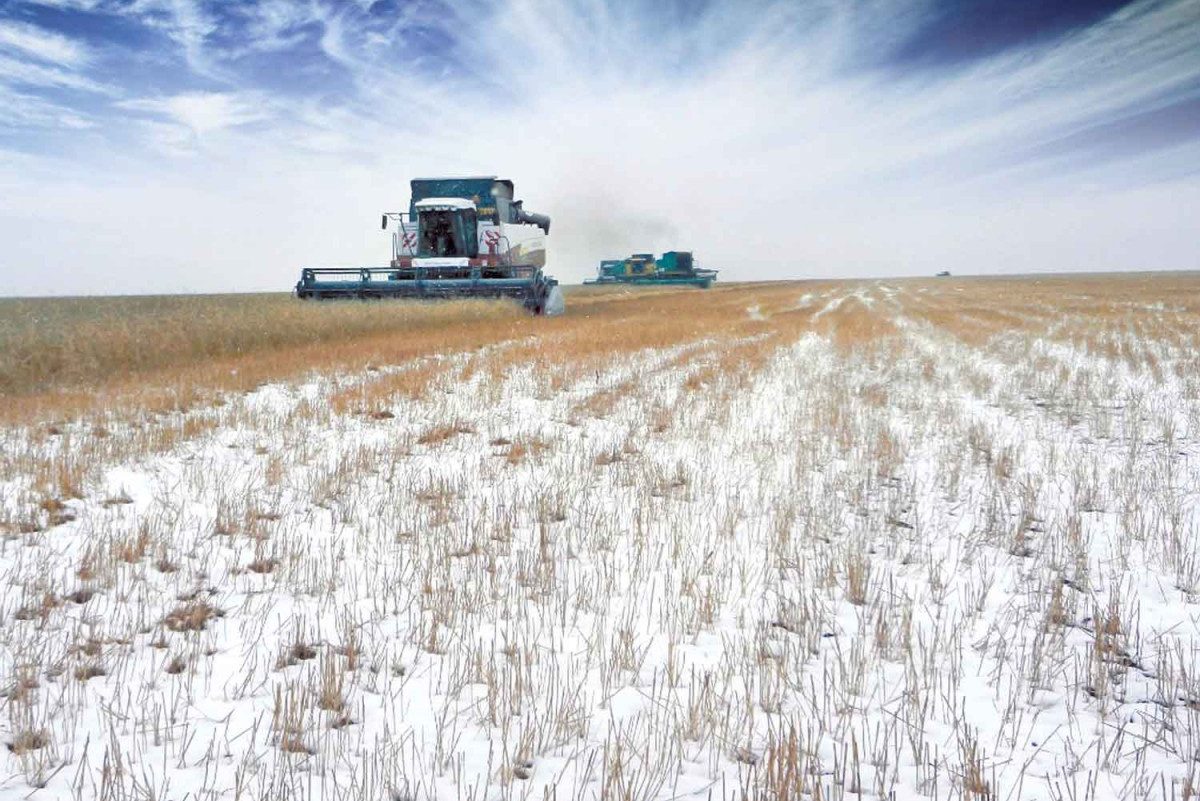
You mean we aren't globally warming---but entering an ice age that has nothing to do with man.I guess this comes as no surprise to those of us who have been watching the global cooling trend for the last 11 years. Last year the growing season was shorter by 51 days from the 30-year average. This year were already at 57 days. The snow and cold continue coast to coast in the breadbasket states and farmlands.
One more problem to add to the self-inflicted shots to both feet by Biden and democrat AGW nuts. This means not only will costs for fuel and fertilizers to create food be an issue, but we also now have to worry that farmers will now only be able to get one planting and harvest this year. A reduction of output by half. You think food prices are high now, wait a month...
The potential for famine in the US is now likely, not to mention the third world will be seeing massive famine and deaths.
Record-Breaking May Cold/Snow Headed For Denver, Seattle And Many Others, As Crop Planting Woes Persist; + Out-Of-Season Cyclone Drives Antarctic Air Unusually-Far North Into Brazil - Electroverse
The COLD TIMES are returning... Welcome to the next Grand Solar Minimum and Pole Shift. A quickening is occurring. Prepare.electroverse.net
Turtlesoup
Diamond Member
- Aug 10, 2020
- 15,903
- 16,745
- 2,288
But we do know that CO2 isn't forcing climate....Since you refuse to read Shakun's study you have no right to make any comment whatsoever about it. And if you had any familiarity with actual science you'd know that no one depends solely on correlation to attribute causation. And if you had ever had the most basic course in logic you'd know that geologic record does not prove that CO2 can't be forcing the climate.
Ice core samples CLEARLY show that higher levels of CO2 are a lagging indicator of a warming period, not a cause of them. We have repeatedly been warmed and cooled. As the earth warms, CO2 is released from its icy prisons (perma frost, ice, snow, water) and enters the atmosphere. Ice core samples show over and over, that higher levels of CO2 are usually at the end of a warming period right before an ice age or cooler period begins. ERGO extra CO2 in the atmosphere neither warms or keeps the earth warmer. It isn't even capable of preventing a cooling period much less cause a warming one.
Water VAPER is the only GREEN HOUSE common enough to have any possibility of warming----
Dude, Shakun provided a Q&A so that idiots like you wouldn't do what you are trying to do which is misapply their work.Since you refuse to read Shakun's study you have no right to make any comment whatsoever about it. And if you had any familiarity with actual science you'd know that no one depends solely on correlation to attribute causation. And if you had ever had the most basic course in logic you'd know that geologic record does not prove that CO2 can't be forcing the climate.
Summary and FAQ’s related to the study by Marcott et al. (2013, Science)
Q: Is the rate of global temperature rise over the last 100 years faster than at any time during the past 11,300 years?
A: Our study did not directly address this question because the paleotemperature records used in our study have a temporal resolution of ~120 years on average, which precludes us from examining variations in rates of change occurring within a century. Other factors also contribute to smoothing the proxy temperature signals contained in many of the records we used, such as organisms burrowing through deep-sea mud, and chronological uncertainties in the proxy records that tend to smooth the signals when compositing them into a globally averaged reconstruction. We showed that no temperature variability is preserved in our reconstruction at cycles shorter than 300 years, 50% is preserved at 1000-year time scales, and nearly all is preserved at 2000-year periods and longer. Our Monte-Carlo analysis accounts for these sources of uncertainty to yield a robust (albeit smoothed) global record. Any small “upticks” or “downticks” in temperature that last less than several hundred years in our compilation of paleoclimate data are probably not robust, as stated in the paper.
Prepared by Shaun A. Marcott, Jeremy D. Shakun, Peter U. Clark, and Alan C. Mix
Oh, Lord, another True Believer. This global warming (cooling? Doesn't matter?? Just something, anything??) is such a weird religious belief.I guess this comes as no surprise to those of us who have been watching the global cooling trend for the last 11 years. Last year the growing season was shorter by 51 days from the 30-year average. This year were already at 57 days. The snow and cold continue coast to coast in the breadbasket states and farmlands.
Maryland where I garden a large garden must be immune to all this, since our growing season stays the same year after year, at least it has for the last 42 years.
Toddsterpatriot
Diamond Member
Oh, Lord, another True Believer. This global warming (cooling? Doesn't matter?? Just something, anything??) is such a weird religious belief.
Maryland where I garden a large garden must be immune to all this, since our growing season stays the same year after year, at least it has for the last 42 years.
Yeah, Billy Bob pulled "51 day shorter growing season" out of his ass.
Toddsterpatriot
Diamond Member
Nope... Last years growing days in the northern hemisphere... But then you always do pull thing from your ass..
Post your proof.
Length of the growing season in the contiguous 48 states, 1895 to 2020Nope... Last years growing days in the northern hemisphere... But then you always do pull thing from your ass..

Climate Change Indicators: Length of Growing Season | US EPA
This indicator measures the length of the growing season in the contiguous 48 states.
 www.epa.gov
And if you're going to try to tell us this is fake news, you're going to have to explain how they got their hands on several million old Farmer's Amanacs and "corrected" them.
Toddsterpatriot
Diamond Member
Thanks for the link.
Where did it say, "Last year the growing season was shorter by 51 days from the 30-year average"?
Or "This year were already at 57 days"?
ReinyDays
Platinum Member
Oh okay. I planted potatoes on March 15th same as always and my garden is growing just fine. I don't know where that 57 day shortfall so far this year is, but it sure as hell isn't Virginia.
This got me laughing ... second post ... it's been as average as average can be here on the West Coast ... the drought is over the Colorado Plateau, coastal areas have been getting enough rain ...
Cardinal Carminative
VIP Member
- Apr 2, 2022
- 4,397
- 1,001
- 73
Oh okay. I planted potatoes on March 15th same as always and my garden is growing just fine. I don't know where that 57 day shortfall so far this year is, but it sure as hell isn't Virginia.
See, this is the point: what you are experiencing is one data point in a much larger set of data points. It's like saying that the average height of a kindergarten kid is 40" but you know your child is only 38" tall, that doesn't mean that the average isn't 40".
This is called "anecdotal data" in the sciences. When dealing with a global topic like AGW or global climate, you have to look at a much larger data set than just one point.
There's a reason measurements have a "distribution".
Cardinal Carminative
VIP Member
- Apr 2, 2022
- 4,397
- 1,001
- 73
This got me laughing ... second post ... it's been as average as average can be here on the West Coast ... the drought is over the Colorado Plateau, coastal areas have been getting enough rain ...
And, again, local data points don't really mean much in isolation of the larger data set.
In statistics we often measure a sample which stands in for the larger population. For instance we measure a very large number of temperatures all over the earth which will hopefully give us a good estimate of what the real average is for ALL POINTS on the globe.
Hopefully you can see that anecdotal data such as what your personal local experience is does not mean that there isn't a larger overall change in the values.
Cardinal Carminative
VIP Member
- Apr 2, 2022
- 4,397
- 1,001
- 73
Too funny....
If it were warming, you all would be screaming GLOBAL WARMING at the top of your lungs. When it's cooling you all want to discard it because it don't fit your fearmongering narrative. Got it...
That has nothing to do with the concept of "windowing data". This is a known problem with data manipulation. Some fraudsters like to window the data so they get the results they want.
There's always ups and downs in data like this. The key is what is the overall secular trend of the data?
Windowing Data hides the overall trend by focusing on a wiggle in the data to the exclusion of the larger picture. Kind of a form of lying with data.
See, this is the point: what you are experiencing is one data point in a much larger set of data points. It's like saying that the average height of a kindergarten kid is 40" but you know your child is only 38" tall, that doesn't mean that the average isn't 40".
This is called "anecdotal data" in the sciences. When dealing with a global topic like AGW or global climate, you have to look at a much larger data set than just one point.
There's a reason measurements have a "distribution".
Or colorado is experiencing one data point in a larger set of data points known as "weather". In this case, it is more specifically called La Nina.
Cardinal Carminative
VIP Member
- Apr 2, 2022
- 4,397
- 1,001
- 73
Or colorado is experiencing one data point in a larger set of data points known as "weather". In this case, it is more specifically called La Nina.
When you aggregate weather over averaged over a long time and a region you wind up with "climate".
Billy_Bob
Diamond Member
- Thread starter
- #79
And it continues Globally....
 electroverse.net
Monthly Low Temp Records Fall In Argentina; Cold Turkey; Late Start Crops; + Additional Cold Waves Headed For The United States - Electroverse
Grand Solar Minimum and Pole Shift: The Future Looks Cold. Prepare.
Cardinal Carminative
VIP Member
- Apr 2, 2022
- 4,397
- 1,001
- 73
And it continues Globally....
Monthly Low Temp Records Fall In Argentina; Cold Turkey; Late Start Crops; + Additional Cold Waves Headed For The United States - Electroverse
Grand Solar Minimum and Pole Shift: The Future Looks Cold. Prepare.
Unfortuantely it is not true that the earth is cooling.
Here's the latest from NASA.
Similar threads
- Replies
- 102
- Views
- 4K
- Replies
- 118
- Views
- 5K
New Topics
-

-

-
 Israel Day Parade in New York Proceeds Peacefully, Without the Mayor
- Started by Zincwarrior
- Replies: 1