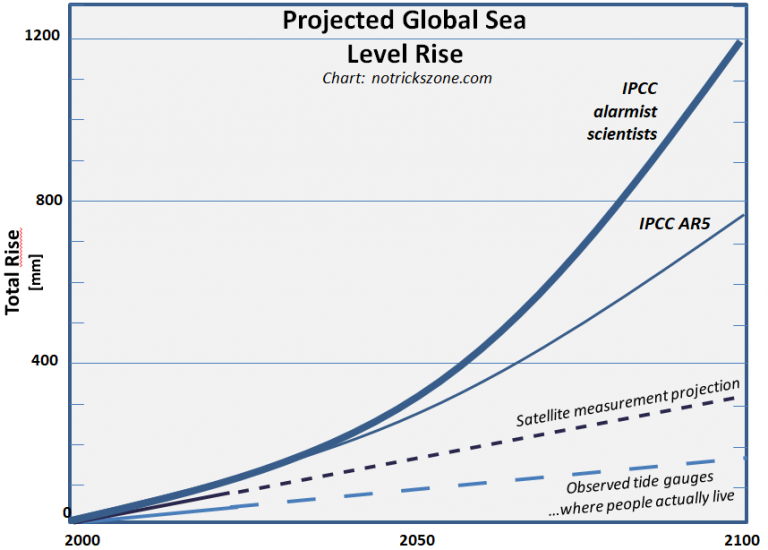
The graph I provided is measuring sea level increase in terms of meters...yours is measuring inches across more than 100 years...and isn't particularly accurate...it is the product of some very shady measuring systems such as tacking satellite numbers onto data collected via physical tide gages...
Prof. em. Nils Axel Mörner, one of the worlds leading sea level experts examined sea levels between Denmark and Sweden and found that contrary to the reports by alarmists, sea level is actually dropping. The tide record in Stockholm is the longest in Europe and he found that the mean long-term change in sea level is a decline of 3.8 mm per year. The land mass itself is rising 49mm per year due to post glacial rise of the land mass...the difference leaves actual sea level rise at about 1.1m per year...
Then there are the multiple papers which find that sea levels were considerably higher 6000 years ago than they are at present.
https://www.sciencedirect.com/science/article/pii/S0031018218306023
Clip:“~6000 cal yr B.P. old oysters can be found from between 3.8 ± 0.1 m to 2.5 ± 0.1 m above present day mean sea level. … Dead (fossil) oysters were collected from between 1 and 3 m above the centre of the live oyster band in a more sheltered cleft inside the notch. The oldest sample with an age of 5270–4950 cal yr B.P. was collected at an elevation of 3.01 ± 0.1 m above the apex of the notch. The ages decrease with elevation down to 920–710 cal yr B.P. at 1.03 m.”
• “In all the sites, the 14C age of the dead oysters inside the notches increases with increasing elevation above present day MSL. Clearly, relative sea level was 2 to 3 m higher than present between 6000 and 3000 B.P. and has steadily fallen since.”
• “There was a progressive warming from ~13,500 years ago to a peak at 6500 ± 200 years ago followed by a cooling of −2.6 °C to the present day.”
“[A]t a more sheltered site inside a bay on Ko Pha Nak, the highest preserved oyster shell is at 3.2 ± 0.1 m above MSL and has a younger 14C calibrated age of 5845–5605 cal yr B.P. Furthermore,
oysters from 3.8 ± 0.1 m above present day MSL, encrusted on a stalactite in a cave at West Railay Beach has a 14C calibrated age of 6176–6041 cal yr B.
P.”
https://www.sciencedirect.com/science/article/pii/S0964569118303429
“Regionally, the sea levels in the PRD [Pearl River Delta, China] region and Japan show no significant acceleration from 1900 to present, but only oscillations. This result is consistent with the other coastal area of the world where long-term tide gauges are located. Policy making, and management, should therefore focus on adaptive measures linked to the monitoring by tide gauges and Global Navigation Satellite System (GNSS) of relative sea level rise and land subsidence. Extreme sea level rise warnings based on predictions by never validated models, or speculations, that are defocusing coastal management from every other relevant situation, should be discharged.”
“[T]he long-term tide gauges of the world show no significant sign of sea level acceleration since the start of the 20th century.”
“Ocean and coastal management in the area should be based on the accurate monitoring of the relative sea level rise and the subsidence of the land by coupled tide gauge and Global Navigation Satellite System measurements, rather than models’ predictions and speculations defocusing coastal management from more relevant situations than the non-existent threat of extreme sea level rise.”
The State of the World’s Beaches
Clip: The application of an automated shoreline detection method to the sandy shorelines thus identified resulted in a global dataset of shoreline change rates for the 33 year period 1984–2016. Analysis of the satellite derived shoreline data indicates that 24% of the world’s sandy beaches are eroding at rates exceeding 0.5 m/yr, while 28% are accreting and 48% are stable.
https://www.sciencedirect.com/science/article/abs/pii/S0277379116303304
Clip: We present a Holocene relative sea-level (RSL) database for the Caribbean region (5°N to 25°N and 55°W to 90°W) that consists of 499 sea-level index points and 238 limiting dates. The database was compiled from multiple sea-level indicators (mangrove peat, microbial mats, beach rock and acroporid and massive corals). We subdivided the database into 20 regions to investigate the influence of tectonics and glacial isostatic adjustment on RSL. We account for the local-scale processes of sediment compaction and tidal range change using the stratigraphic position (overburden thickness) of index points and paleotidal modeling, respectively. We use a spatio-temporal empirical hierarchical model to estimate RSL position and its rates of change in the Caribbean over 1-ka time slices.
Because of meltwater input, the rates of RSL change were highest during the early Holocene, with a maximum of 10.9 ± 0.6 m/ka in Suriname and Guyana and minimum of 7.4 ± 0.7 m/ka in south Florida from 12 to 8 ka. Following complete deglaciation of the Laurentide Ice Sheet (LIS) by ∼7 ka,
mid-to late-Holocene rates slowed to < 2.4 ± 0.4 m/ka.The hierarchical model constrains the spatial extent of the mid-Holocene highstand.
RSL did not exceed the present height during the Holocene, except on the northern coast of South America, where in Suriname and Guyana, RSL attained a height higher than present by 6.6 ka (82% probability).The highstand reached a maximum elevation of +1.0 ± 1.1 m between 5.3 and 5.2 ka. Regions with a highstand were located furthest away from the former LIS, where the effects from ocean syphoning and hydro-isostasy outweigh the influence of subsidence from forebulge collapse.”
And it goes on and on and on...published papers indicating that the models upon which alarmism is based are wrong...that sea levels were considerably higher thousands of years ago than they are today...that your alarmist handwaving is nothing more than uninformed hysterics.
") -
-


