global warming summit in France

The Point is this, With short residency time and multiple sinks that are sucking up the CO2, there has been no warming for almost 19 years and the increase is not causing a response of increased temperature. The CO2 - Water Vapor positive forcing link does not exist by empirical observed evidence. The AGW most critical hypothesis fails empirical review.

Remember when I started out on this forum, you showed took troposphere data in a vacuum and then CO2 in a vacuum. What's wrong with adding cubes up all over the earth that have all the temperature differences measured, and then solving? It seems you're looking in a vacuum again. The CO2 residency times acceleratingly get worse as the Ocean gets stuck up.

I'll let Crick argue that our spike is steeper because I think he/she will win. I should probably move on from this thread soon.

Our current spike is less than 100 years long. The resolution of 10,000 year averages in the record would mean our current spike would never be seen until it reaches 8,000 plus years in length above the highest point of the overall average.

What this mean to you is this, the record is not clear enough to rule out previous spikes of this magnitude from happening naturally. And as others have posted on this forum, there are other proxies out there which show much greater resolution and the fact that these spikes are not unprecedented or outside of natural variation. You simply do not have the resolution to back up your assertion.

The current "spike" is still accelerating. It could not possibly turn around for at least a couple of centuries. And NO ONE has ever come up with a natural mechanism that could cause a spike that quick. There has been nothing like the current conditions since the Permian Triassic extinction.
 
I will respond: the yellow is from 2000, an outlier. The distribution at 2015, then is very nearly the same as say 1900. I won't do this much longer.

Wow... Holding on to straws...

ipcc_fig1-4_models_obs.png


Note the grey area is not identified as any significance in AR5 thus the empirical evidence is outside of the actual error bars..
 
The Point is this, With short residency time and multiple sinks that are sucking up the CO2, there has been no warming for almost 19 years and the increase is not causing a response of increased temperature. The CO2 - Water Vapor positive forcing link does not exist by empirical observed evidence. The AGW most critical hypothesis fails empirical review.

Remember when I started out on this forum, you showed took troposphere data in a vacuum and then CO2 in a vacuum. What's wrong with adding cubes up all over the earth that have all the temperature differences measured, and then solving? It seems you're looking in a vacuum again. The CO2 residency times acceleratingly get worse as the Ocean gets stuck up.

I'll let Crick argue that our spike is steeper because I think he/she will win. I should probably move on from this thread soon.

Our current spike is less than 100 years long. The resolution of 10,000 year averages in the record would mean our current spike would never be seen until it reaches 8,000 plus years in length above the highest point of the overall average.

What this mean to you is this, the record is not clear enough to rule out previous spikes of this magnitude from happening naturally. And as others have posted on this forum, there are other proxies out there which show much greater resolution and the fact that these spikes are not unprecedented or outside of natural variation. You simply do not have the resolution to back up your assertion.

The current "spike" is still accelerating. It could not possibly turn around for at least a couple of centuries. And NO ONE has ever come up with a natural mechanism that could cause a spike that quick. There has been nothing like the current conditions since the Permian Triassic extinction.
Again, you have no proof of your contention.
 
If you have studied climate models I am interested in how you determined that nearly all Global Warming is human caused. There are hundreds of independent variables that affect Global climate, it is not possible to isolate the human contribution as THE reason for for a fraction of a degree increase.


Because the scientist disagree with you that's why. They have clearly stated that humans induced co2 has caused this warming the past 60 years.

BWHAAAAAAAAAAAAA what a pant load of AGW crap..

Ok.. Lets play your game Mathew.. ( I dont expect you to answer becasue your meme is about to be shredded)

Crick and several others have run from this direct question supported by empirical evidence. Lets see if your man enough to answer.

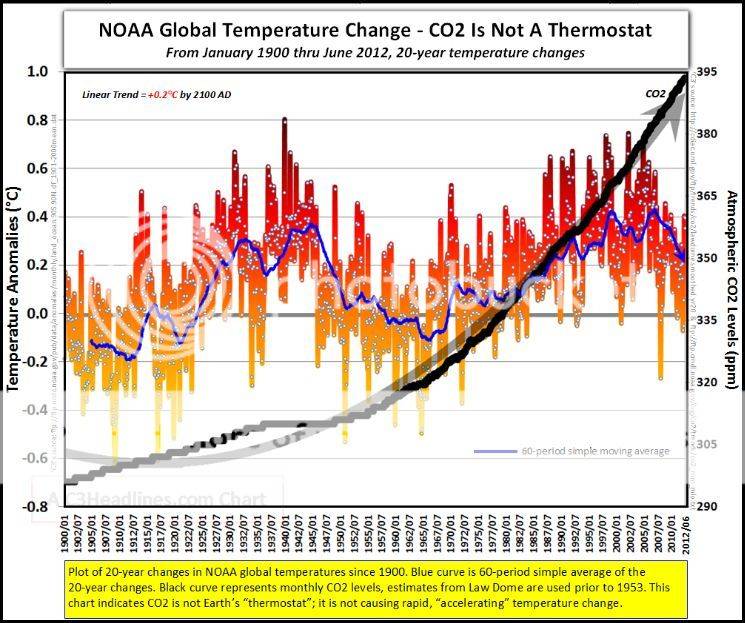
Below are two rates of warming from the Hadcrut3 lower troposphere. One is from the period 1900 through 1950 and the the other is 1951 through 2000. Below each is the rate of warming.

trend


The trend for the period 1900-1950 is 0.51 deg C or 0.103/decade

This trend occurred before CO2 became a rapidly increasing according to the IPCC and is near or is the Natural Variational rate.

The trend for 1951-2000 is 0.50 deg C or 0.100 deg C/decade.

This means that the two rates of warming are statistically insignificantly different DESPITE the rapid rise in CO2 and equals the NATURAL VARIATION rate seen in the previous warming trend..

GlobaltempChange.jpg


So by simple observation we can see the problem with the hypothesis of runaway temp caused by CO2. During the time they claim runway rise, it was nothing of the sort, and even given the rise in CO2 there was no discernible increase in that natural rise.

SO Tell me Mathew, where is your magical CO2 signal and how did you determine it? Also, how did you manage to stop natural variation in the second temperature rise period and make it all man caused as the IPCC and EPA have stated in AR3, AR4, and the EPA endangerment finding? The IPCC and EPA have provided no scientific basis for their statements.

Why do Alarmist run from empirical evidence and facts?
So far Crick, Fidgewell, Old Rocks, Mathew, among others, have run from the question and empirical evidence presented.

Why do alarmist make wild ass claims and then run away when the facts show their position untenable and indefensible?
 
Schmidt doesn't sound very smart... it was a 90 % interval. lol.

I think it's pretty much done... I can stop typing now.

Gavin Schmidt is the director of NASA..

upload_2015-12-6_19-30-36.jpeg


Gavin A. Schmidt is a climatologist, climate modeler and Director of the NASA Goddard Institute for Space Studies in New York, and co-founder of the award winning climate science blog RealClimate. Wikipedia
Born: United Kingdom
Employer: Goddard Institute for Space Studies
Books: Climate Change: Picturing the Science
Education: The Corsham School, University of Oxford, Jesus College, Oxford, University College London


Now that is funny as hell... You dissed your own alarmist for stating a belief you find offensive and show your modeling a failure.. This is Priceless,,
 
Silly Billy, you have yet to present any kind of evidence. All you have done is make predictions that turn out to be 180 degrees off. And make ridiculous claims concerning your education.

I hope the leaders in Paris hammer out an agreement that starts to address AGW.
 
I don't feel Billy Bob will be convincing very many more people of his side, so I will most likely stop, at least until tomorrow.
 
Silly Billy, you have yet to present any kind of evidence. All you have done is make predictions that turn out to be 180 degrees off. And make ridiculous claims concerning your education.

I hope the leaders in Paris hammer out an agreement that starts to address AGW.

You still have not addressed the empirical evidence I posted to you several months ago.. I re-posted it to Mathew today.. why dont you take a stab at it since you have been avoiding it for months.. For that matter, how about catatonic take a stab at it too...
global warming summit in France | Page 3 | US Message Board - Political Discussion Forum
 
Crick, you miss context and spatial resolution.

Your lack of context and lack of spatial resolution understanding

I want to hear this. What CONTEXT are you talking about Billy Boy?

And, as far as resolution goes:

Response by Marcott <i>et al</i>.

Global Temperature Reconstruction: We combined published proxy temperature records from across the globe to develop regional and global temperature reconstructions spanning the past ~11,300 years with a resolution >300 yr; previous reconstructions of global and hemispheric temperatures primarily spanned the last one to two thousand years. To our knowledge, our work is the first attempt to quantify global temperature for the entire Holocene.

-- Shaun Marcott
 
Last edited:
I will respond: the yellow is from 2000, an outlier. The distribution at 2015, then is very nearly the same as say 1900. I won't do this much longer.

Wow... Holding on to straws...

View attachment 56403

Note the grey area is not identified as any significance in AR5 thus the empirical evidence is outside of the actual error bars..
Crap. The temperature is set to go over 1 degree for 2015. That puts us up in the upper two thirds of that graph, Mr. Dimbulb.
 
Crick, you miss context and spatial resolution.

Your lack of context and lack of spatial resolution understanding

I want to hear this. What CONTEXT are you talking about Billy Boy?

And, as far as resolution goes:

Response by Marcott <i>et al</i>.

Global Temperature Reconstruction: We combined published proxy temperature records from across the globe to develop regional and global temperature reconstructions spanning the past ~11,300 years with a resolution >300 yr; previous reconstructions of global and hemispheric temperatures primarily spanned the last one to two thousand years. To our knowledge, our work is the first attempt to quantify global temperature for the entire Holocene.

-- Shaun Marcott

Proxies greater than 300 year averages... our current rise wont even show in any of his works due to the spatial resolution's. A spike that has started less than 100 years ago will not show up in a 300 year average.. So even his work fails to have the resolution to prove your claim.
 
I will respond: the yellow is from 2000, an outlier. The distribution at 2015, then is very nearly the same as say 1900. I won't do this much longer.

Wow... Holding on to straws...

View attachment 56403

Note the grey area is not identified as any significance in AR5 thus the empirical evidence is outside of the actual error bars..
Crap. The temperature is set to go over 1 degree for 2015. That puts us up in the upper two thirds of that graph, Mr. Dimbulb.

Nope... your using the adjusted up data not the unadjusted data which barely has a 0.61 deg C rise since 1855.

Its the lack of a common frame of reference that causes the biggest problem. Then the infilling and making up data where none exists (fabricating) that causes then next set of problems.

The word is CONTEXT..

The worst piece of evidence error bars are the error bounds of your finished product. if you have changed the value you have increased the error bar width making all of your work suspect and prone to erroneous and worthless output. I wonder what the error bars are for the made up data all over the oceans, land and polar regions is and how they came up with the boundaries?
 
Last edited:
The Point is this, With short residency time and multiple sinks that are sucking up the CO2, there has been no warming for almost 19 years and the increase is not causing a response of increased temperature. The CO2 - Water Vapor positive forcing link does not exist by empirical observed evidence. The AGW most critical hypothesis fails empirical review.

Remember when I started out on this forum, you showed took troposphere data in a vacuum and then CO2 in a vacuum. What's wrong with adding cubes up all over the earth that have all the temperature differences measured, and then solving? It seems you're looking in a vacuum again. The CO2 residency times acceleratingly get worse as the Ocean gets stuck up.

I'll let Crick argue that our spike is steeper because I think he/she will win. I should probably move on from this thread soon.

Our current spike is less than 100 years long. The resolution of 10,000 year averages in the record would mean our current spike would never be seen until it reaches 8,000 plus years in length above the highest point of the overall average.

What this mean to you is this, the record is not clear enough to rule out previous spikes of this magnitude from happening naturally. And as others have posted on this forum, there are other proxies out there which show much greater resolution and the fact that these spikes are not unprecedented or outside of natural variation. You simply do not have the resolution to back up your assertion.

The current "spike" is still accelerating. It could not possibly turn around for at least a couple of centuries. And NO ONE has ever come up with a natural mechanism that could cause a spike that quick. There has been nothing like the current conditions since the Permian Triassic extinction.

No its not..

The upward velocity of CO2 has diminished in the last 20 years .

In past years, the news was pretty grim. For roughly a decade, emissions were rising at about four percent a year, bringing CO2 levels up to 400 parts-per-million earlier this year for the first time in millions of years. But earlier in this decade, the growth rate dropped to one percent a year for a couple of years. At the time, it wasn't clear whether this was a momentary blip or indicative of a long-term change.

The 2014 figures show growth of only half a percent, making it three years straight with declining carbon emissions. Since this came during a period of economic expansion, it's made the report's authors optimistic: "the world’s economy grew by three percent, showing a partial decoupling between the growth in global CO2 emissions and that in the economy."

{Emphasis mine}

Crick seems to be behind the times on his dire predictions. Rate of increase is less than 1% and has been for over a decade.

Source
 
year ppm/yr
1959 0.94
1960 0.54
1961 0.95
1962 0.64
1963 0.71
1964 0.28
1965 1.02
1966 1.24
1967 0.74
1968 1.03
1969 1.31
1970 1.06
1971 0.85
1972 1.69
1973 1.22
1974 0.78
1975 1.13
1976 0.84
1977 2.10
1978 1.30
1979 1.75
1980 1.73
1981 1.43
1982 0.96
1983 2.13
1984 1.36
1985 1.25
1986 1.48
1987 2.29
1988 2.13
1989 1.32
1990 1.19
1991 0.99
1992 0.48
1993 1.40
1994 1.91
1995 1.99
1996 1.25
1997 1.91
1998 2.93
1999 0.93
2000 1.62
2001 1.58
2002 2.53
2003 2.29
2004 1.56
2005 2.52
2006 1.76
2007 2.22
2008 1.60
2009 1.89
2010 2.42
2011 1.86
2012 2.63
2013 2.06
2014 2.17
co2_data_mlo_anngr.png

ESRL Global Monitoring Division - Global Greenhouse Gas Reference Network

At present, we have doubled the rate that we are adding CO2 to the atmosphere from when we first started measuring it in 1969. At 2 ppm per year, that means another 50 ppm by 2040.

Thanks for proving my point.. From 1990 it is essentially a flat line..
 
And another day goes by and the empirical evidence showing the global warming (man made) fraud goes unchallenged.

No link between water vapor and CO2 even with a 120ppm rise.
 
year ppm/yr
1959 0.94
1960 0.54
1961 0.95
1962 0.64
1963 0.71
1964 0.28
1965 1.02
1966 1.24
1967 0.74
1968 1.03
1969 1.31
1970 1.06
1971 0.85
1972 1.69
1973 1.22
1974 0.78
1975 1.13
1976 0.84
1977 2.10
1978 1.30
1979 1.75
1980 1.73
1981 1.43
1982 0.96
1983 2.13
1984 1.36
1985 1.25
1986 1.48
1987 2.29
1988 2.13
1989 1.32
1990 1.19
1991 0.99
1992 0.48
1993 1.40
1994 1.91
1995 1.99
1996 1.25
1997 1.91
1998 2.93
1999 0.93
2000 1.62
2001 1.58
2002 2.53
2003 2.29
2004 1.56
2005 2.52
2006 1.76
2007 2.22
2008 1.60
2009 1.89
2010 2.42
2011 1.86
2012 2.63
2013 2.06
2014 2.17
co2_data_mlo_anngr.png

ESRL Global Monitoring Division - Global Greenhouse Gas Reference Network

At present, we have doubled the rate that we are adding CO2 to the atmosphere from when we first started measuring it in 1969. At 2 ppm per year, that means another 50 ppm by 2040.

Thanks for proving my point.. From 1990 it is essentially a flat line..
What a fucked up liar you are, Silly Billy.
1990 1.19
1991 0.99
1992 0.48
1993 1.40
1994 1.91
1995 1.99
1996 1.25
1997 1.91
1998 2.93
1999 0.93

2000 1.62
2001 1.58
2002 2.53
2003 2.29
2004 1.56
2005 2.52
2006 1.76
2007 2.22
2008 1.60
2009 1.89

Now you silly little lying ignoramous, does that look like a flat line. Yea Gods and little fishes, you lie with the evidence staring you in the face. What a Goddamned moron you are.
 
And another day goes by and the empirical evidence showing the global warming (man made) fraud goes unchallenged.

No link between water vapor and CO2 even with a 120ppm rise.
My goodness, you stupid ass, if the atmosphere warms, it hold more water vapor.

It's Water Vapor, Not the CO2

ACS Climate Science Toolkit | Narratives
Remark: “The Earth has certainly been warming since we have added so much CO2 to the atmosphere from fossil fuel burning.”
Reply: “Forget the CO2. Water vapor is the most important greenhouse gas. It controls the Earth’s temperature.”


It’s true that water vapor is the largest contributor to the Earth’s greenhouse effect. On average, it probably accounts for about 60% of the warming effect. However, water vapor does not control the Earth’s temperature, but is instead controlled by the temperature. This is because the temperature of the surrounding atmosphere limits the maximum amount of water vapor the atmosphere can contain. If a volume of air contains its maximum amount of water vapor and the temperature is decreased, some of the water vapor will condense to form liquid water. This is why clouds form as warm air containing water vapor rises and cools at higher altitudes where the water condenses to the tiny droplets that make up clouds.


The greenhouse effect that has maintained the Earth’s temperature at a level warm enough for human civilization to develop over the past several millennia is controlled by non-condensable gases, mainly carbon dioxide, CO2, with smaller contributions from methane, CH4, nitrous oxide, N2O, and ozone, O3. Since the middle of the 20th century, small amounts of man-made gases, mostly chlorine- and fluorine-containing solvents and refrigerants, have been added to the mix. Because these gases are not condensable at atmospheric temperatures and pressures, the atmosphere can pack in much more of these gases . Thus, CO2 (as well as CH4, N2O, and O3) has been building up in the atmosphere since the Industrial Revolution when we began burning large amounts of fossil fuel.


If there had been no increase in the amounts of non-condensable greenhouse gases, the amount of water vapor in the atmosphere would not have changed with all other variables remaining the same. The addition of the non-condensable gases causes the temperature to increase and this leads to an increase in water vapor that further increases the temperature. This is an example of a positive feedback effect. The warming due to increasing non-condensable gases causes more water vapor to enter the atmosphere, which adds to the effect of the non-condensables.


Forum List

Back
Top