Dagosa
Gold Member
- Oct 22, 2012
- 22,594
- 6,162
- 198
Sea ice is not snow ice. Another name for snow ice is glacial ice.What percent of Earth ice is SEA ICE??????
Why don’t you look it up?
Follow along with the video below to see how to install our site as a web app on your home screen.
Note: This feature may not be available in some browsers.
Sea ice is not snow ice. Another name for snow ice is glacial ice.What percent of Earth ice is SEA ICE??????
Sea ice is not snow ice. Another name for snow ice is glacial ice.
Why don’t you look it up?
Honestly, only a dipshit would make such a distinction.Sea ice is not snow ice. Another name for snow ice is glacial ice.
Why don’t you look it up?
Honestly, only a dipshit would make such a distinction.
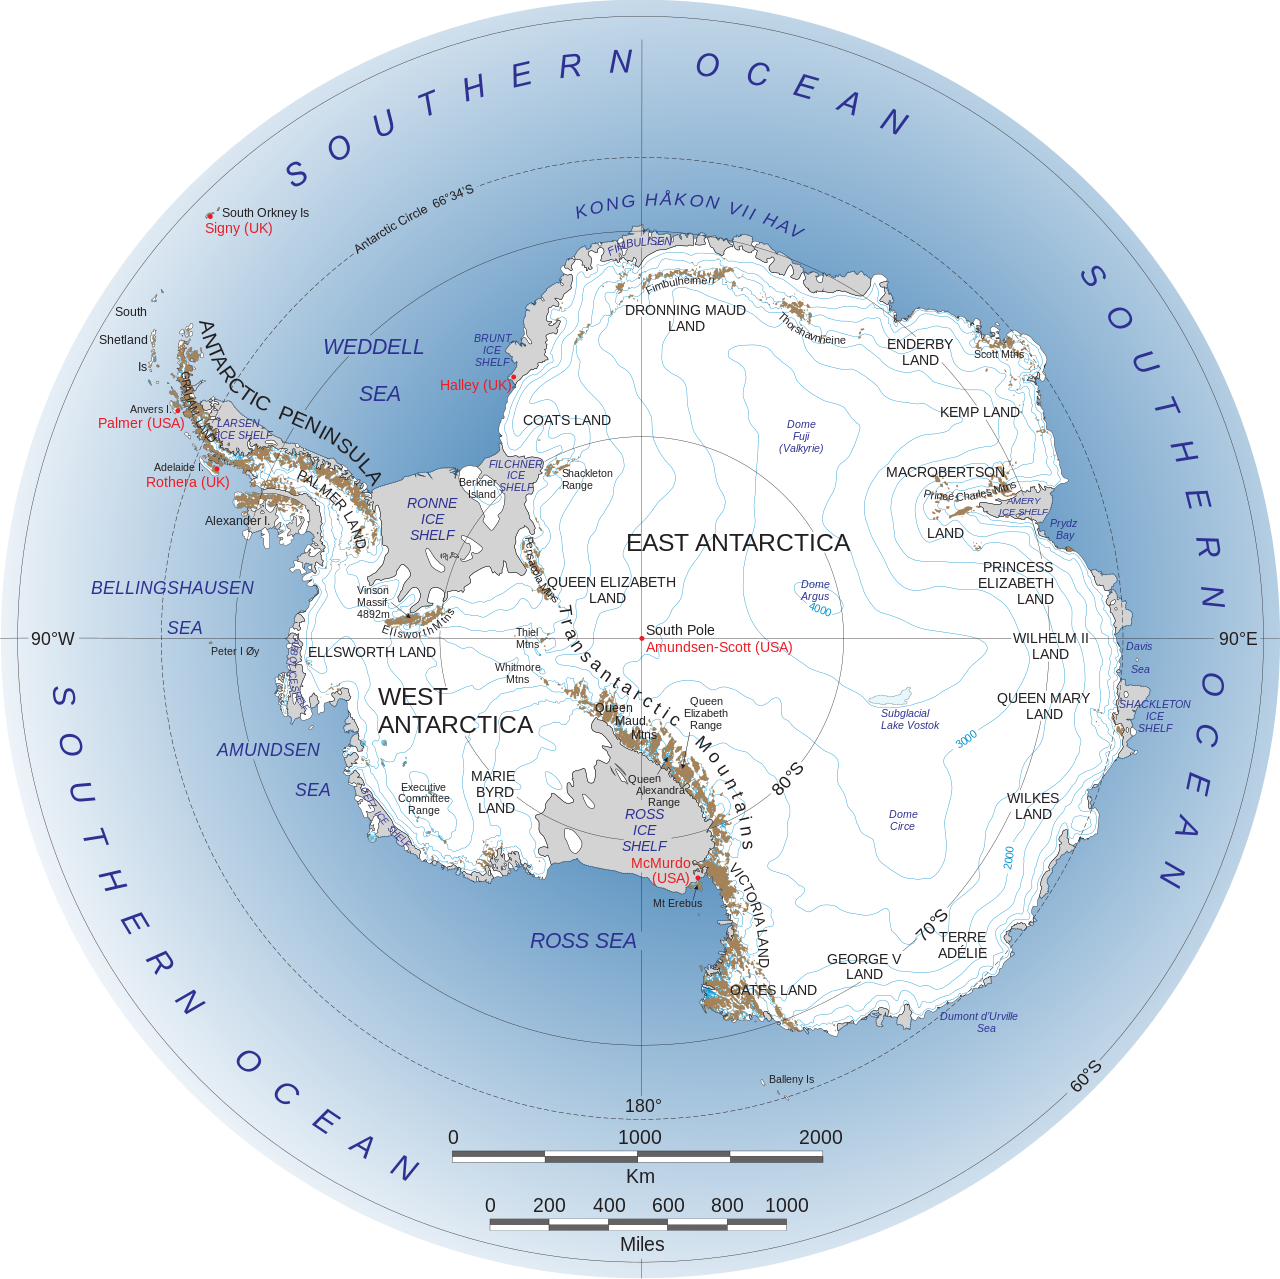
Bogus data like you always post from unreliable sources that have been caught fabricating and cherry picking data in addition to using crappy politics driven models and proxy data. NASA has been caught several times, along with NOAA being liars when it comes to climate data. They have absolutely no credibility and you are an idiot sourcing them.West Antarctic is the second largest "national" region on Earth, falling between Russia and Canada, but this is still regional and even within West Antarctica, the trend is not uniform.
West Antarctica is largely covered by the Antarctic ice sheet, but there have been signs that climate change is having some effect and that this ice sheet may have started to shrink slightly. Over the past 50 years, the west coast of the Antarctic Peninsula has been – and still is – one of the most rapidly warming parts of the planet,[1][2] and the coasts of the Peninsula are the only parts of West Antarctica that become (in summer) ice-free. These constitute the Marielandia Antarctic tundra and have the warmest climate in Antarctica. The rocks are clad in mosses and lichens that can cope with the intense cold of winter and the short growing-season.
- "Impacts of climate change". Discovering Antarctica. Retrieved 2021-11-20.
- ^ "WMO verifies one temperature record for Antarctic continent and rejects another". public.wmo.int. 2021-06-30. Retrieved 2021-11-20.
West Antarctica - Wikipedia
en.wikipedia.org
The world as a whole has - as you all already know - done this:
View attachment 857427
View attachment 857429Data.GISS: GISS Surface Temperature Analysis (GISTEMP v4)
data.giss.nasa.gov
View attachment 857431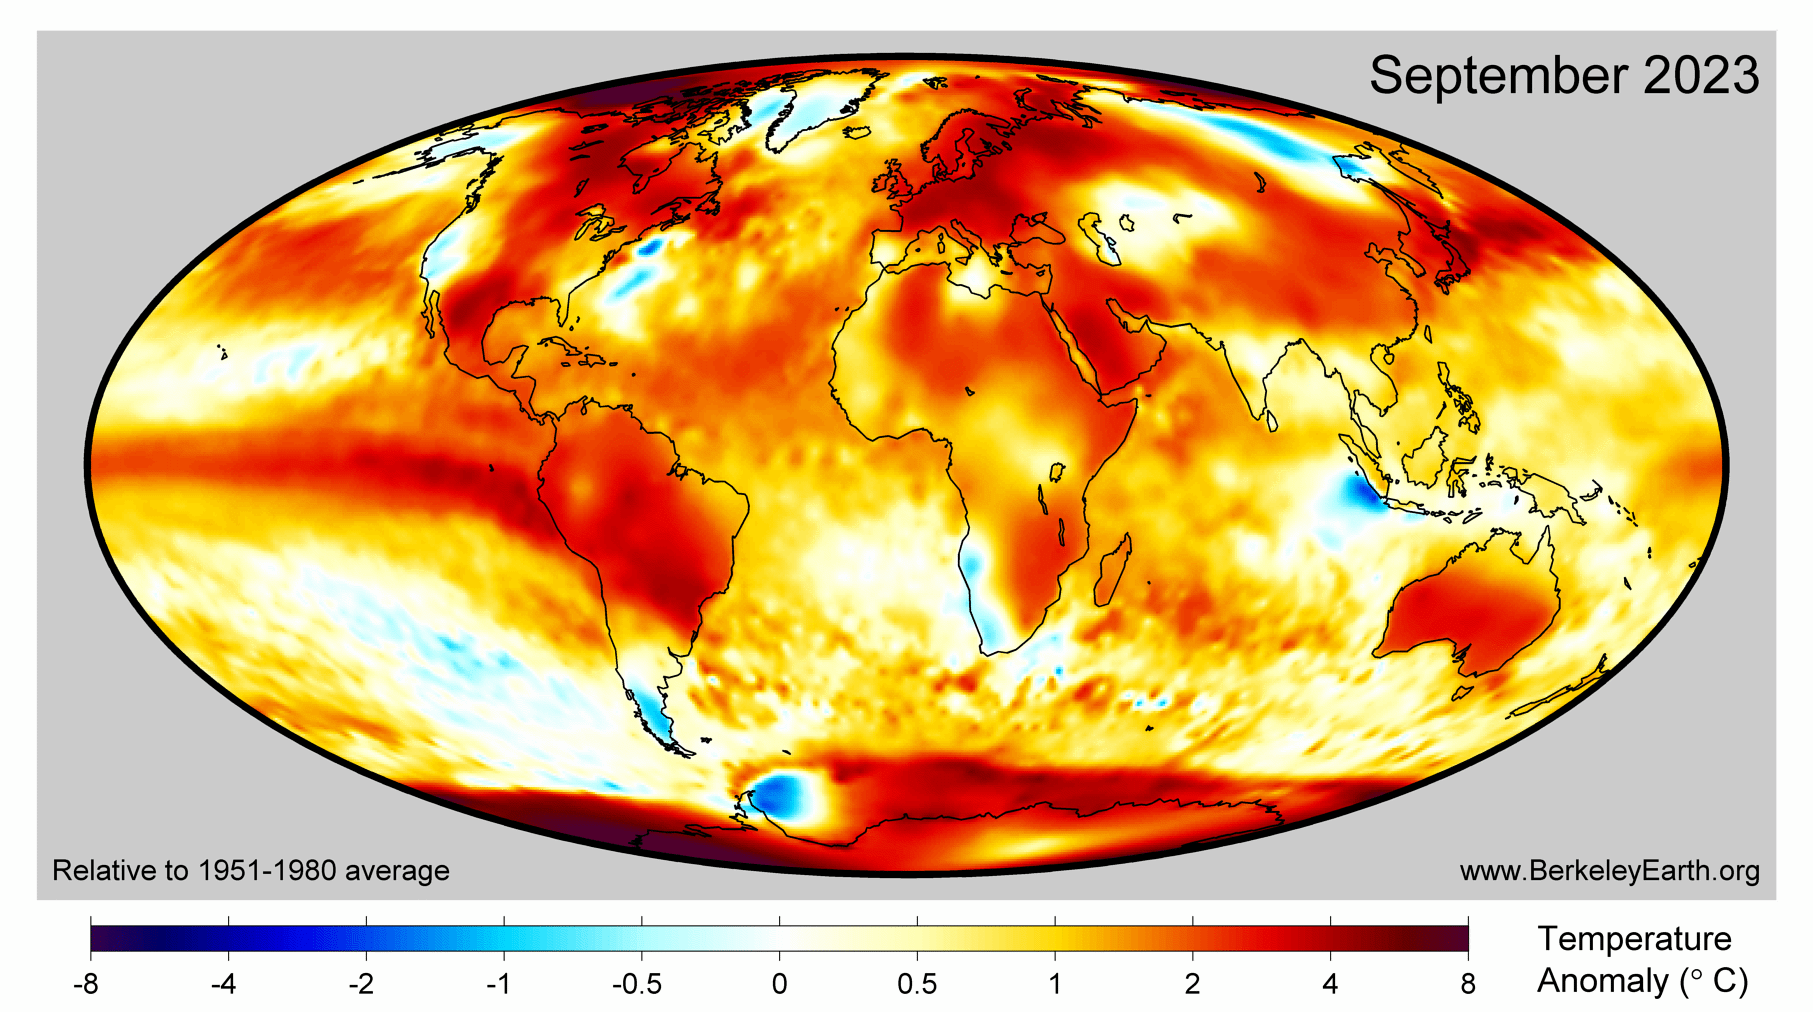
September 2023 Temperature Update - Berkeley Earth
September 2023 was the warmest since records began in 1850. 2023 is virtually certain to become a record warm year, and likely to exceed 1.5 °C.berkeleyearth.org

Climate change: global temperature
Earth's surface temperature has risen about 2 degrees Fahrenheit since the start of the NOAA record in 1850. It may seem like a small change, but it's a tremendous increase in stored heat.www.climate.gov
Bull shit, only an ignoramus wouldn’t know the differenceHonestly, only a dipshit would make such a distinction.
Ha haSea ice is not significant.
Earth ice
90% on land mass Antarctica
7% on land mass Greenland
0.3% on land mass Ellesmere Island
the rest, 2.7% is mountain tops and sea ice...
Where is the ice = on LAND WITHIN 600 miles of a pole.... and LAND MOVES....
What question.ANSWER THE QUESTION
Ha ha
A comparison between the two is inconsequential . BOTH ARE MELTING
You can’t prove otherwise. It’s not me who has to supply proof bubba. I’m agreeing with every climate science research facility in the world.The burden of proof is on you bozo. You’re hilariously in the bag for dumbass crowd. Go ahead…disprove it instead of making up shit that a comparative proves anything.it doesn’t…bubba. All the ice is melting.Document LIQUID WATER on Antarctica.
When you claim ice is "melting," you first have to show LIQUID WATER, and you don't have any....
So a natural interglacial period?
Try adding a verb in there somewhere.So a natural interglacial period?
Why? It wasn't needed. You posted some pictures and my comment was... So a natural interglacial period? As in there is nothing that is occurring today that hasn't been occurring naturally for millions of years.Try adding a verb in there somewhere.
The pictures were in response to a claim by EMH just above, that there was no liquid water to be found on the Antarctic continent.Why? It wasn't needed. You posted some pictures and my comment was... So a natural interglacial period? As in there is nothing that is occurring today that hasn't been occurring naturally for millions of years.
I think you like to argue for the sake of arguing.
Ahhhh... also a normal condition for an interglacial period as wellThe pictures were in response to a claim by EMH just above, that there was no liquid water to be found on the Antarctic continent.
")
The reason why the shelf is cracked is due to too coldWest Antarctic is the second largest "national" region on Earth, falling between Russia and Canada, but this is still regional and even within West Antarctica, the trend is not uniform.
West Antarctica is largely covered by the Antarctic ice sheet, but there have been signs that climate change is having some effect and that this ice sheet may have started to shrink slightly. Over the past 50 years, the west coast of the Antarctic Peninsula has been – and still is – one of the most rapidly warming parts of the planet,[1][2] and the coasts of the Peninsula are the only parts of West Antarctica that become (in summer) ice-free. These constitute the Marielandia Antarctic tundra and have the warmest climate in Antarctica. The rocks are clad in mosses and lichens that can cope with the intense cold of winter and the short growing-season.
- "Impacts of climate change". Discovering Antarctica. Retrieved 2021-11-20.
- ^ "WMO verifies one temperature record for Antarctic continent and rejects another". public.wmo.int. 2021-06-30. Retrieved 2021-11-20.
West Antarctica - Wikipedia
The world as a whole has - as you all already know - done this:
View attachment 857427
View attachment 857429Data.GISS: GISS Surface Temperature Analysis (GISTEMP v4)
View attachment 857431September 2023 Temperature Update - Berkeley Earth
September 2023 was the warmest since records began in 1850. 2023 is virtually certain to become a record warm year, and likely to exceed 1.5 °C.
Climate change: global temperature
Earth's surface temperature has risen about 2 degrees Fahrenheit since the start of the NOAA record in 1850. It may seem like a small change, but it's a tremendous increase in stored heat.
Exactly…The pictures were in response to a claim by EMH just above, that there was no liquid water to be found on the Antarctic continent.
That is false
View attachment 857957
Temperature trends and variability for the Arctic and Antarctic regions. (A) Annual mean anomalies of the combined Land-Ocean Temperature Index (L-OTI) for the Arctic (64°N to 90°N), Antarctic (64°S to 90°S), and globe between 1880 and 2018 (zonal data bins defined by data acquired at https://data. giss.nasa.gov relative to the mean period 1951-1980). Temperature anomalies for the Arctic during each of the four IPYs, the first of which was based in the Arctic, are highlighted in purple. (B) Annual [January to December (J-D)] mean temperature change (°C) in the Northern (left) and Southern (right) hemispheres for 1986-2005 (upper) and 1986-2018 (lower) relative to the mean period of 1951-1980. Generated from the NASA/Goddard Institute for Space Studies (GISS) online plotting tool (2); the GISS analysis is based on updated Global Historical Climatology Network v3/SCAR (2, 3) and updates to Analysis (v3).
That is also false
View attachment 857959
NASA Scientific Visualization Studio | Antarctic Ice Loss 2002-2016
The mass of the Antarctic ice sheet has changed over the last several years. Research based on observations from NASA’s twin NASA/German Aerospace Center’s twin Gravity Recovery and Climate Experiment (GRACE) satellites indicates that between 2002 and 2016, Antarctica shed approximately 125...svs.gsfc.nasa.gov
From the study at the link found in the linked "TruthSeeker" article (top notch science source). Indented text from the study, outdented text and graphics are mine. The content of this study provide no support whasoever that AGW theory is refuted in any way, shape or manner:
During the second half of the twentieth century, the West Antarctic Ice Sheet (WAIS) has undergone significant warming at more than twice the global mean and thus is regarded as one of the most rapidly warming regions on Earth.
and
The EOF2 results in the enhanced cold southerly winds on the continental WAIS through the cyclonic conditions over the Amundsen Sea region and a blocking high in the Drake Passage and northern Antarctic Peninsula, causing the WAIS cooling trend.
the West Antarctic Ice Sheet (WAIS) is losing mass at an accelerated rate, with a cumulatively contribution to the global sea level rise of 6.9 ± 0.6 mm since the late 1970s (Rignot et al. 2019)
and
Since 1958, the WAIS experienced significant warming (Steig et al. 2009) with the warming rate of more than doubling the global mean for the second half of the twentieth century. Hence, the WAIS is one of the most rapidly warming regions on Earth (Bromwich et al. 2013, 2014)
and
The pattern of SST in the tropical Pacific Ocean has changed, with negative SST anomalies in the equatorial eastern tropical Pacific since the end of the twentieth century, as shown by the negative phase of the interdecadal Pacific oscillation (IPO)
Here are the Interdecadal Pacific Oscillation Index and Atlantic Multidecadal Oscillation Index. Note that the Pacific goes negative simultaneously with the Atlantic going positive.
View attachment 857942
and
Due to the similar spatial patterns of SST anomalies to ESNO, the IPO is also considered as the ENSO-like decadal variability.
However, note the combined ENSO index is predominantly positive since 1976.
View attachment 857944
MEI (old): NOAA Physical Sciences Laboratory
US Department of Commerce, NOAA, Physical Sciences Laboratorypsl.noaa.gov
and
There still exists question concerning the cooling over the West Antarctica is primarily attributable to what processes and mechanisms and from which areas.
So, apparently not the slam dunk refutation of AGW that Billy Boy would have us believe.
and
In this study, we used the monthly mean surface atmospheric temperature (SAT; measured at 2 m above ground) data at Byrd Station by Bromwich et al. (2013, 2014), which is the only WAIS station with complete long-term temperature records from 1958 to 2021. Their annual and seasonal averages show high and significant correlations (r > 0.8, p < 0.05) with ERA5 temperature fields over most of the WAIS
So their temperature conclusions are based on data from ONE SITE that they claim to be representative because it matches the estimates of interior temperature trends from a CLIMATE REANALYSIS MODEL. Another reconstruction model is used for SST values. Good for the gander, eh.
It is highly unlikely that the air, 2 meters above the ground, is significantly affected by intermittent geothermal heating beneath ~3,000 feet of ice.
and
Discussion and conclusionsThe absence of West Antarctic warming in the early twenty-first century is reminiscent of the event of global mean SAT slowdown (global warming hiatus), with the negative phase of the IPO being one of their common major possible causes. The global warming hiatus ended during the early 2010s, and warming reaccelerated associated with the shift of the Pacific decadal oscillation (PDO) from negative phase to positive phase, the increasing North Atlantic Oscillation (NAO), and the positive phase of Atlantic multidecadal oscillation (AMO) (Zhang et al. 2019). However, cooling over the WAIS still appeared over the early 2010s, suggesting the West Antarctic climate is more sensitive to tropical Pacific forcing, compared to PDO, NAO, and AMO. A recent study (Li et al. 2021) also reported that a teleconnection pattern may be established by the tropical Atlantic and Indian Oceans, driving the Rossby wave trains through direct and indirect paths, and affecting the SAT change of the WAIS, but the effect is relatively weak.In conclusion, the WAIS experienced a significant cooling trend, especially in spring, during the recent 20 years (1999–2018), which is a response to the interactions of coupled sea ice, ocean, and atmosphere. Here we attributed the observed significant spring cooling to the strong cyclonic anomalies in the Amundsen Sea, and anticyclonic conditions in the Drake Passage and Antarctic Peninsula presented by EOF2, related to negative IPO, and the increase of SIC in the Amundsen Sea also driven by tropical forcing. While the cooling effect of the positive SAM on West Antarctica is expected (Marshall 2007; Marshall and Thompson 2016; Fogt and Marshall 2020), it has not played a role in the recent cooling. This underscores the importance of regional atmospheric circulation variability associated with the tropical Pacific SST anomalies for driving the central WAIS air temperature. There is no robust agreement on the tropical Pacific SST variability in the future by the different atmospheric global climate models (AGCMs) (Lee et al. 2021). However, Cai et al. (2022) show a robust increase of the projected change in ENSO-related SST variability under all emission scenarios when applied over a century-long time window, IPO variability has not been fully explored for future projections. Thus, this confirms that the tropical Pacific climate oscillation is still an important source of uncertainty in West Antarctic air temperature obtained from future projections.The GCMs from the phase 6 of the Coupled Model Intercomparison Project (CMIP6) are an important tool to make the projections of future climate changes over Antarctica. However, 28 CMIP6 multimodel ensemble mean in historical does not capture the significant cooling trend of the WAIS over the early twenty-first century, but the significant warming trend at the South Pole reported by Clem et al. (2020) (Fig. ES6, Table ES1), which implies substantial uncertainties in the future temperature projections of CMIP6 models on the WAIS. It is easy to understand that, despite the relatively high reliability of the models for the global-scale temperature changes, their representations of climatological interdecadal transitions over Antarctica are generally less accurate, probably due to their coarse resolution and sparseness of polar-special physical schemes. Therefore, for the better projections of future Antarctic temperature changes, the GCMs cannot ignore the influence of the interdecadal oscillation and need to incorporate more physical mechanisms.
