Forecast Discussion: Rapid Cooling Ahead.. Its already started...

Easterbrook_Projection_1024.jpg


Easterbrook2000ab.png


figure-7.png


Easterbrook_Zoom_1024.jpg


1_Projections_cfMainstreamSkeptics.gif
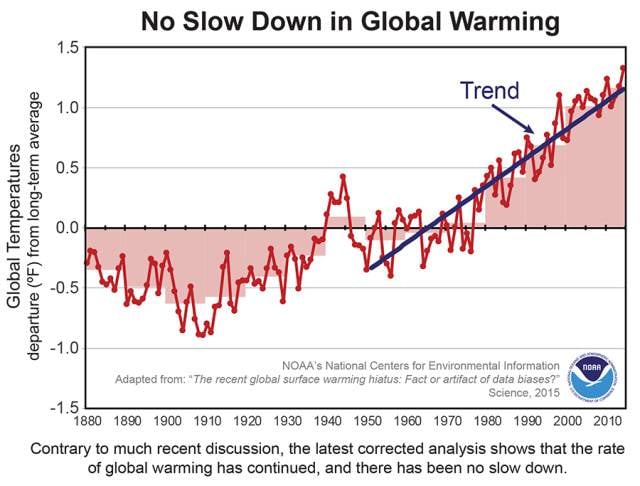
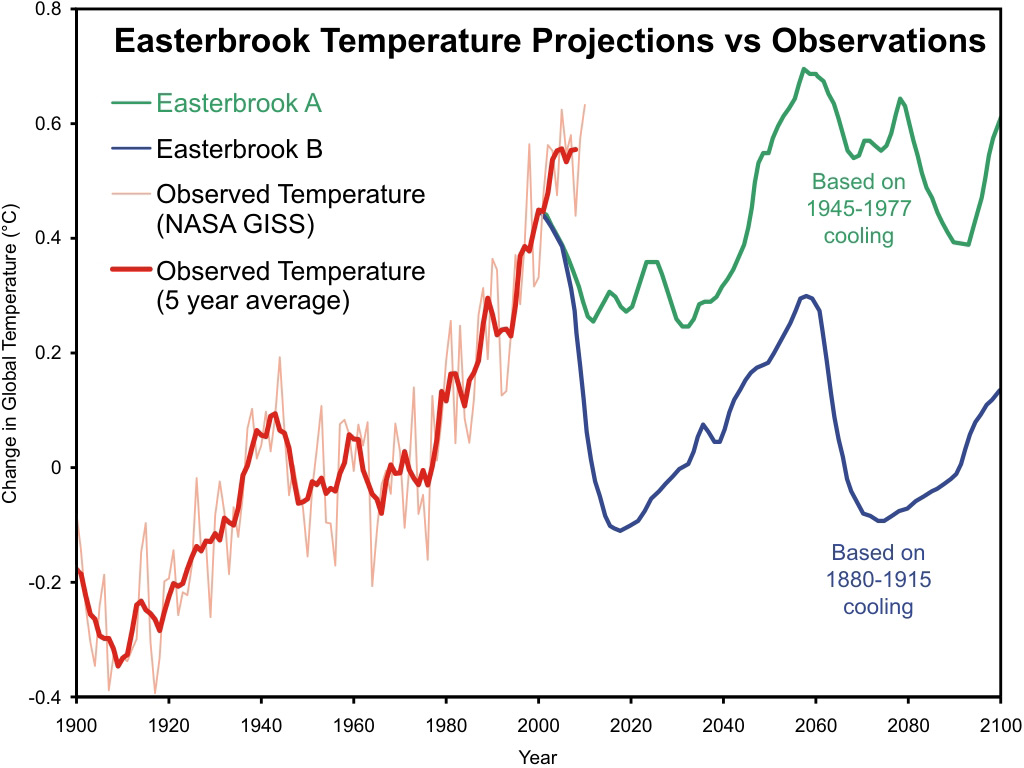
You know what is stunningly funny; you used ADJUSTED DATA for all of your graphs.. That's right, made up crap and the site you took them from is SKS... The cartoon boys who couldn't beat their way out of a wet paper bag.

NO Attribution...

No DATA set identification...

NO Methods identification...or explanations..

SO tell me where you got this "credible" crap from or are you scared that revealing your lies source would make it easier for me to discredit? The fact you provided no information is proof enough of your deceptions. The fact you failed to credit Skeptical Science as its source is funny as hell.

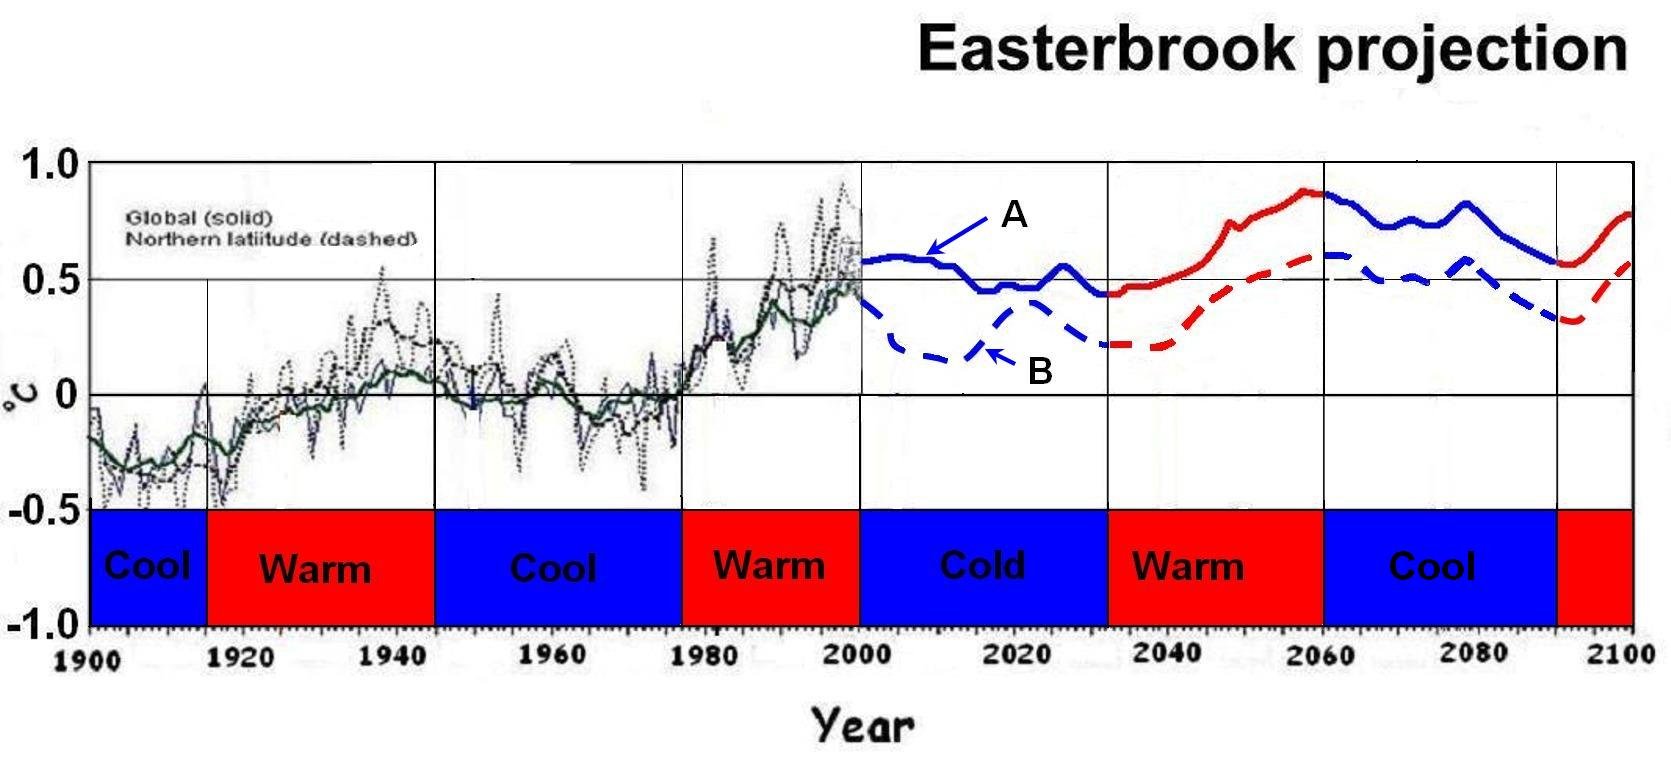
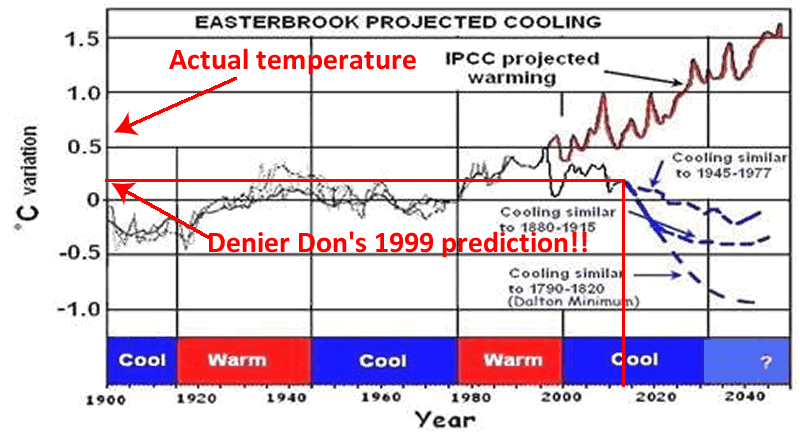
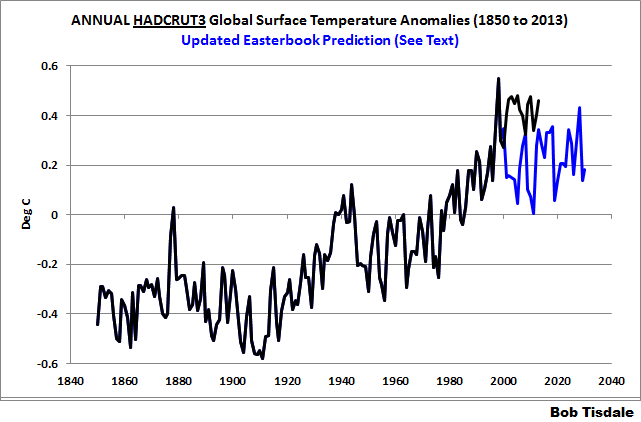
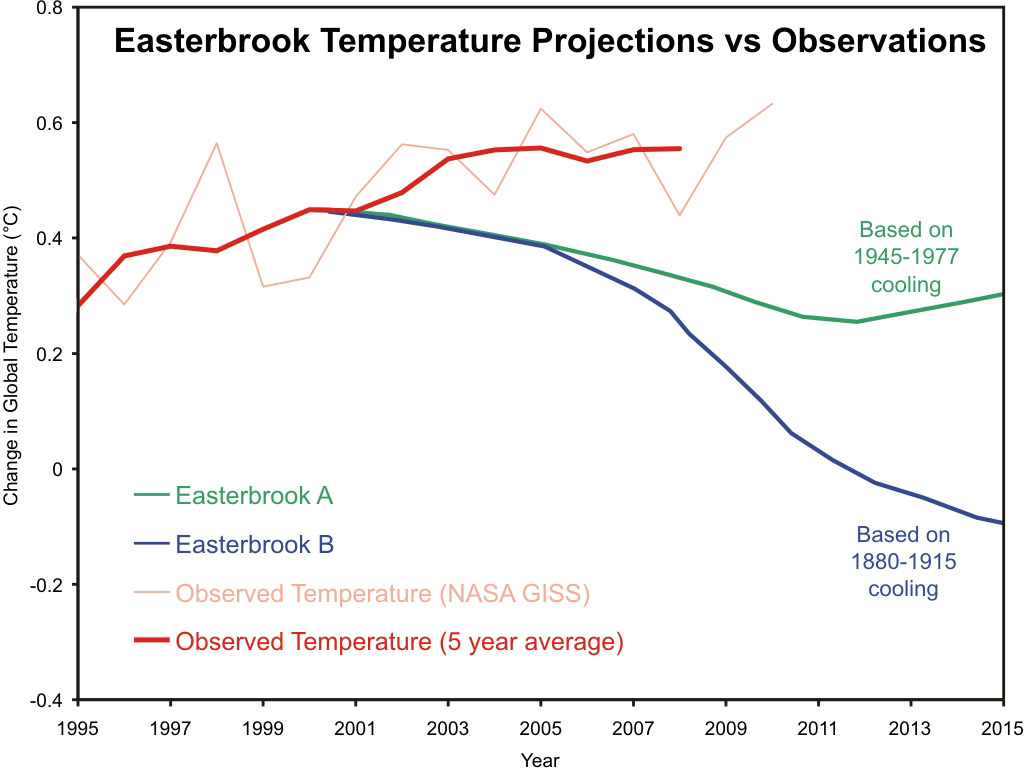
And yet when Evans predictions are place against unaltered data he is right on the money..
 
Last edited:
The only identification required on any of those graphs was Easterbrook. The man is one more laughing stock. I've known of the failure of his projections for years now. He's famous as a failure. Do you ever wonder why this sort of behavior is so common among your experts? I don't.
 
The only identification required on any of those graphs was Easterbrook. The man is one more laughing stock. I've known of the failure of his projections for years now. He's famous as a failure. Do you ever wonder why this sort of behavior is so common among your experts? I don't.
Actually, your the laughing stock.. Evans predictions are right on the money. A far cry from your religious cult IPCC pontifications. You dont have a dam clue and you lie out of your ass.. and your models fail 100% of the time yet you tout them as gospel...
 
Last edited:
Read the sig, dude. Feel the burn. I bet its raising your local temperatures.

PS, you just finished posting Easterbrook's work, not Evans.

PPS, I've discovered the reason for your confusion about Evans 2006. You're stupid. No (well, probably yes, but...) Evans 2006, which presents spectra of direct measurements of backradiation produced by greenhouse gases in the atmosphere, is the work of W.F.J. Evans of Northwest Research Associates. It is NOT the work of David Evans, Australian electrical engineer and stupid denier. Prior to this evening when I came across his work while searching for W.F.J. Evans 2006, I had never heard of David Evans.
 
Last edited:
We are now in a cooling phase of the planet

What were entering now is a cooling phase where the oceans are all cooling rapidly and circulations change to support this.

IF you want to discuss the whys, bring in facts and data.. Leave your hype crap at the door. Show me the evidence and tell me why you believe it.


The cooling phase of WHAT?

And, if you'd like to leave some hype crap at the door, grow some balls and admit to this audience that you do not have a degree in atmospheric physics.


Lets see if we can remove some of your ignorance;

globalcool61.jpg


The Pacific Ocean has a warm temperature mode and a cool temperature mode, and in the past century, has switched back forth between these two modes every 25-30 years (known as the Pacific Decadal Oscillation or PDO). In 1977 the Pacific abruptly shifted from its cool mode (where it had been since about 1945) into its warm mode, and this initiated global warming from 1977 to 1998. The correlation between the PDO and global climate is well established. The announcement by NASA’s Jet Propulsion Laboratory that the Pacific Decadal Oscillation (PDO) had shifted to its cool phase is right on schedule as predicted by past climate and PDO changes (Easterbrook, 2001, 2006, 2007). The PDO typically lasts 25-30 years and assures North America of cool, wetter climates during its cool phases and warmer, drier climates during its warm phases. The establishment of the cool PDO, together with similar cooling of the North Atlantic Oscillation (NAO), virtually assures several decades of global cooling and the end of the past 30-year warm phase.

Source

Eastbrooks 'B' scenario is the more likely path of the earth given what we have learned about CO2's inability to influence water vapor and its overall negative forcing. If you use ADJUSTED DATA Eastbrook's projection B has been right on the money.
Yea Gods and little fishes. Can you get any more stupid? Easterbrook's graph starts the projection at 2000. It is presently 2015, and the temperature for this year is going to be about 0.8, not 0.2 or 0.4. Silly Billy, you daily earn your name. His projections are already a massive fail.
 
Read the sig, dude. Feel the burn. I bet its raising your local temperatures.

PS, you just finished posting Easterbrook's work, not Evans.

PPS, I've discovered the reason for your confusion about Evans 2006. You're stupid. No (well, probably yes, but...) Evans 2006, which presents spectra of direct measurements of backradiation produced by greenhouse gases in the atmosphere, is the work of W.F.J. Evans of Northwest Research Associates. It is NOT the work of David Evans, Australian electrical engineer and stupid denier. Prior to this evening when I came across his work while searching for W.F.J. Evans 2006, I had never heard of David Evans.

Another ignorant rant by a fool..

The science is unchanged by whomever does it. Your the one confused as I never once implied the two were one. A Circk's Failure to read again... only AGW agenda and death is what you post and defend. What an ignorant twat!

Both Eastbrook and Evans shown thier work and they have been verified by unaltered data. It's no wonder you folks are altering the records as fast as you can, you must keep the general public from seeing your deception and lies exposed. Damn, life must suck for you liars!
 
We are now in a cooling phase of the planet

What were entering now is a cooling phase where the oceans are all cooling rapidly and circulations change to support this.

IF you want to discuss the whys, bring in facts and data.. Leave your hype crap at the door. Show me the evidence and tell me why you believe it.


The cooling phase of WHAT?

And, if you'd like to leave some hype crap at the door, grow some balls and admit to this audience that you do not have a degree in atmospheric physics.


Lets see if we can remove some of your ignorance;

globalcool61.jpg


The Pacific Ocean has a warm temperature mode and a cool temperature mode, and in the past century, has switched back forth between these two modes every 25-30 years (known as the Pacific Decadal Oscillation or PDO). In 1977 the Pacific abruptly shifted from its cool mode (where it had been since about 1945) into its warm mode, and this initiated global warming from 1977 to 1998. The correlation between the PDO and global climate is well established. The announcement by NASA’s Jet Propulsion Laboratory that the Pacific Decadal Oscillation (PDO) had shifted to its cool phase is right on schedule as predicted by past climate and PDO changes (Easterbrook, 2001, 2006, 2007). The PDO typically lasts 25-30 years and assures North America of cool, wetter climates during its cool phases and warmer, drier climates during its warm phases. The establishment of the cool PDO, together with similar cooling of the North Atlantic Oscillation (NAO), virtually assures several decades of global cooling and the end of the past 30-year warm phase.

Source

Eastbrooks 'B' scenario is the more likely path of the earth given what we have learned about CO2's inability to influence water vapor and its overall negative forcing. If you use ADJUSTED DATA Eastbrook's projection B has been right on the money.
Yea Gods and little fishes. Can you get any more stupid? Easterbrook's graph starts the projection at 2000. It is presently 2015, and the temperature for this year is going to be about 0.8, not 0.2 or 0.4. Silly Billy, you daily earn your name. His projections are already a massive fail.

You cant even read graphs... now that's funny. Taking lessons from Circk again Old Fraud? Or is it because the satellite records and US-CRN show Eastbrook's predictions true? You must lie like hell to try and misrepresent them to keep your faith alive...Gawd you fools are so predictable!
 
PS, here's why I disagree with you and your "cooling phase"

noaa_karl_etal-640x486.jpg
hey Crick, nice graph, read the description under the graph, big words there "latest corrected analysis". And you dare ask me about manipulated/ fake data? You just posted more evidence to my statement of corrupted graphs altered to fit a model. Thank you.
 
Last edited:
English Lesson for JC:

correct
[kuh-rekt]

verb (used with object)
1.
to set or make true, accurate, or right; remove the errors or faults from:
 
English Lesson for JC:

correct
[kuh-rekt]

verb (used with object)
1.
to set or make true, accurate, or right; remove the errors or faults from:
fudged, altered, made up. I have my definitions thank you. Again, you proved my point, there aren't any graphs you post that show raw data, they all show altered datasets, in other words, made up data.

Dude, you can post the rest of your life that corrected data is raw data, but it isn't and you should learn that.
 
Dude, you can post the rest of your life that corrected data is raw data, but it isn't and you should learn that.

Do you work to get that stupid? I never said corrected data were raw data. Corrected data are raw data that have been corrected. But, hey, let's see your raw data. And maybe the opinion of a few experts that it's more accurate that way.
I don't own any, do you? Billy Bob posts it in here all the time. you should go read it. but corrected data isn't raw no matter again how long you wish to post that statement. Corrected is just that corrected, meaning it was altered from the original number. post up the original numbers, you must have them, you love to manipulate them all the time.
 
Dude, you can post the rest of your life that corrected data is raw data, but it isn't and you should learn that.

Do you work to get that stupid? I never said corrected data were raw data. Corrected data are raw data that have been corrected. But, hey, let's see your raw data. And maybe the opinion of a few experts that it's more accurate that way.
BTW, the correct way to write that sentence is: "I never said corrected data was raw data." And, "Corrected data is raw data that has been corrected." But what do you care about grammar eh? Oh that's right, making fun of Frank. What a libturd you are.
 
Too Funny;

NOAA has altered their projections for winter warmth and decreased them by -0.75 deg C. This will pretty much lay the El Niño latent heat waste for the duration of the winter months.. December is looking like it will not allow a "hottest year ev'a" as the temp anomaly has now fallen -1.18deg C. I know this is going to crush the alarmists black little hearts... They were hoping for a "hottest ev'a" claim..
 
December of this year? The month with one day left in it?

Have you got a link?
 
Last edited:
octglob1.PNG


climate-hottest-year-1445400858773-facebookJumbo-v3.png


serveimage


201511.gif
I'm still looking, but this makes me think that your prediction is going to fail.

I found the November analysis

horserace-201511.png


And an elNino chart that shows current conditions in excess of 1998

enso-bars.198001.201511.png
 
Last edited:
Too Funny;

NOAA has altered their projections for winter warmth and decreased them by -0.75 deg C. This will pretty much lay the El Niño latent heat waste for the duration of the winter months.. December is looking like it will not allow a "hottest year ev'a" as the temp anomaly has now fallen -1.18deg C. I know this is going to crush the alarmists black little hearts... They were hoping for a "hottest ev'a" claim..
Silly Billy, you remain the stupidest ass on this board. Not just NOAA, but allmost everybody has this as the hottest year on record. Oh,I know. An international conspiracy involving all the scientists in world.

NO proof of anything... Adhom's galore... Post is worthless drivel

octglob1.PNG


climate-hottest-year-1445400858773-facebookJumbo-v3.png


serveimage


201511.gif
I'm still looking, but this makes me think that your prediction is going to fail.

I found the November analysis

horserace-201511.png


And an elNino chart that shows current conditions in excess of 1998

enso-bars.198001.201511.png

LOL..

I have seen the NOAA fabrications and they mean squat! I posted real world empirical observations and data.. SO tell me, why does everything you post have exaggeration and fabrication done to it?
 

Forum List

Back
Top