Bird's-eye View of Global Carbon Footprint: NASA's OCO-2 Measures CO2 Emissions of Over 100 Nations from Space
13 March, 2023
TWC India
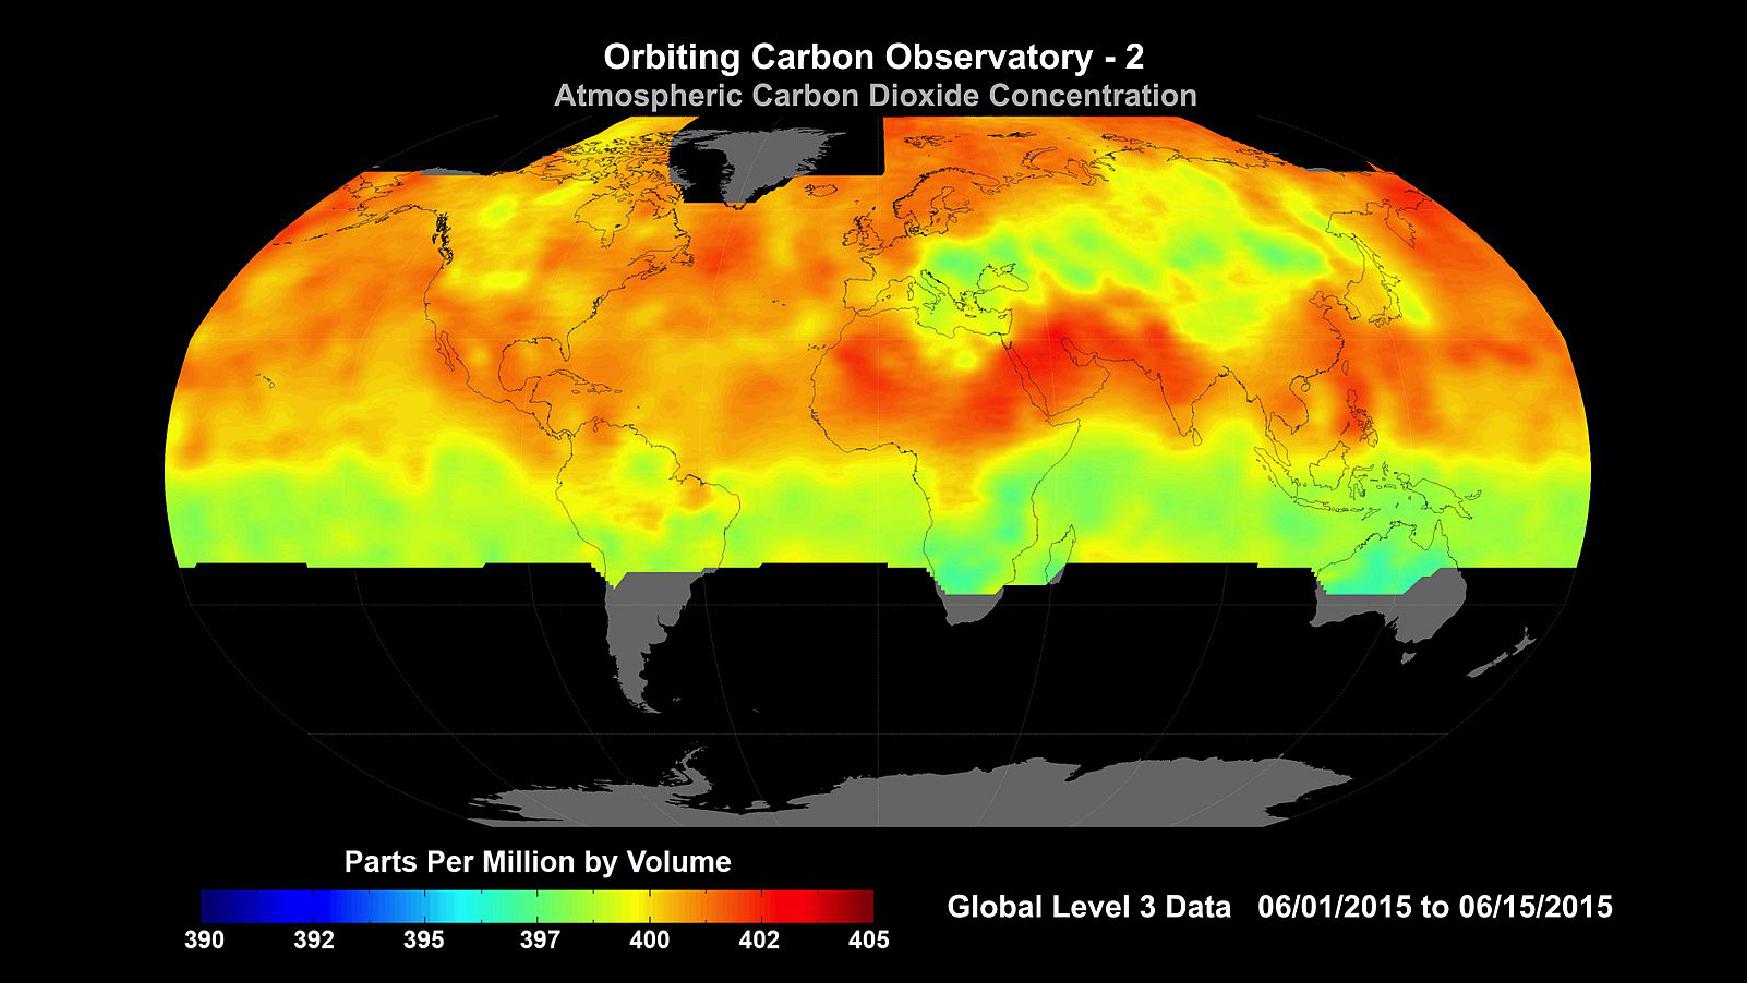
This map shows mean net emissions and removals of carbon dioxide from 2015 to 2020 using estimates informed by NASA’s OCO-2 satellite measurements. Countries where more carbon dioxide was removed than emitted appear as green depressions, while countries with higher emissions are tan or red and appear to pop off the page.
(NASA’s Scientific Visualization Studio)
While the effects of the rise in carbon dioxide emissions can undoubtedly be felt down here on Earth in more ways than one, there seems to be a lot of finger-pointing amongst the nations. In situations like this, an outsider’s perspective is likely the only way to settle matters. And what better way to get said perspective than all the way from space?
NASA’s Orbiting Carbon Observatory-2 (OCO-2) has been tracking CO2 emissions from different parts of the world. Analysis of the data from this satellite reveals that China and the United States are the two countries that emit the most CO2, followed by India, Indonesia, Malaysia, Brazil, Mexico, Iran, Japan, and Germany.
The OCO-2 flies in a near-polar orbit, enabling it to observe most of our planet’s surface at least once every sixteen days. The abundance of carbon dioxide in the atmosphere varies with the time of day and season, so the OCO-2 measurements record changes in CO2 over yearly and seasonal cycles within each year.
Further, to remove the effect of changes in CO2 abundances every day and differences between seasonal variations and long-term changes, OCO-2 makes its measurements in the sun-synchronous orbit. This means that it measures carbon dioxide over a given point on Earth’s surface at the same local mean solar time, NASA said.
Recently, an international team of over 60 researchers utilised data from OCO-2 to quantify increases and decreases in atmospheric carbon dioxide concentrations between 2015 and 2020.
The OCO-2 mission was not specifically designed to estimate emissions from individual countries, but the data from the 100-plus countries comes at an opportune time.
The first-ever Global Stocktake, designed to assess the world’s collective progress toward limiting global warming, as specified in the 2015 Paris Agreement, is to take place in 2023. And the planning and confirming emission reduction targets in support of the Paris Agreement depend on accurate accounting of CO2 emissions and removals.
Apart from the nations mentioned above, including the US, China, India, Indonesia, Malaysia, Brazil, Mexico, Iran, Japan, and Germany, other countries that significantly contribute to CO2 emissions are the United Kingdom (along with the rest of western Europe), Australia, Kazakhstan, most of northern Africa, South Africa, Chile, Thailand, and the Philippines.
")