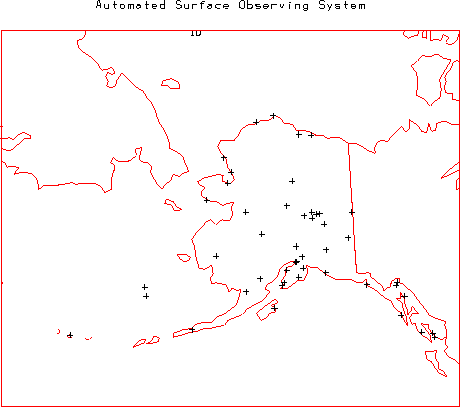
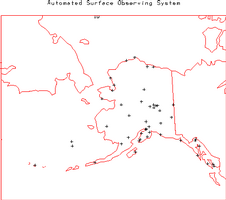
Automated Surface Observing System (ASOS) - The National Weather Service (NWS), Federal Aviation Administration (FAA) and Department of Defense operate this network of 968 stations located throughout the United States (48 in Alaska). The data generally available from ASOS stations includes hourly (and special) observations of air temperature, dew point, wind speed, wind direction, cloud cover, visibility, present weather, and precipitation. Via modem data can be obtained every minute (typically the most recent ~8 hours of observations are kept at the stations). For further information on the
NWS ASOS home page or the
FAA Automated Sensors home page.
 Automated Weather Observing System (AWOS)
 - The FAA and various state agencies (particularly Aviation Divisions of state Departments of Transportation) operate this network of 900 stations located throughout the United States (66 in Alaska). While data is generally available from 552 of these stations (55 in Alaska), the data from the other 348 stations (11 in Alaska) is currently only available via dialup modem (typically the most recent ~3 weeks of observations are kept at the stations). These stations typically provide 20-minute observations of air temperature, dew point, wind speed, wind direction, cloud cover, visibility, altimeter setting, present weather and precipitation. For further information on the AWOS network visit the
FAA Automated Sensors home page.
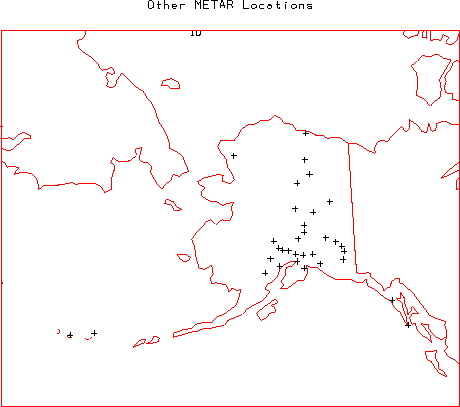
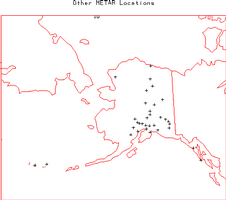
 Other METAR Reports
 - In addition to the ASOS and AWOS there are a number of other observation stations that provide. These include several military stations and sites that report manual observations. There are 249 such observation locations located throughout the United States (33 in Alaska). A large proportion of these observations are limited in some fashion (e.g. no observations at night or just one or two observations in a day). The parameters available vary from station to station, but most provide air temperature, dew point, wind speed, wind direction, cloud cover, and present weather.
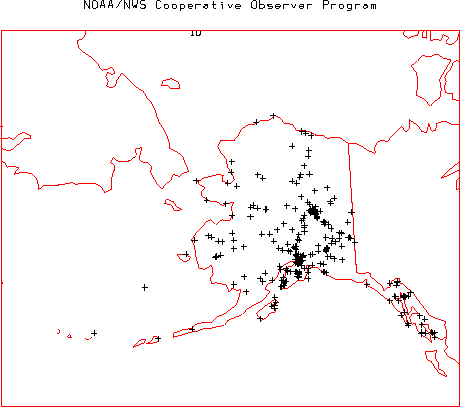
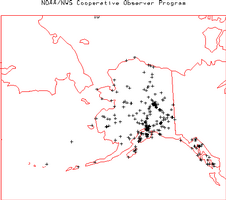
NOAA/NWS Cooperative Observer Program - The National Oceanographic and Atmospheric Administration (NOAA) National Weather Service (NWS) oversees this network with 11852 participating cooperative observers located throughout the United States (297 in Alaska). This network provides daily observations (7am local time) of maximum and minimum air temperature, precipitation, snowfall, and snow depth. Some stations also provide soil temperature, evaporation, and wind run. These data are archived at NOAA/NCDC. For further information visit the
NOAA/NWS Cooperative Observer Program home page.
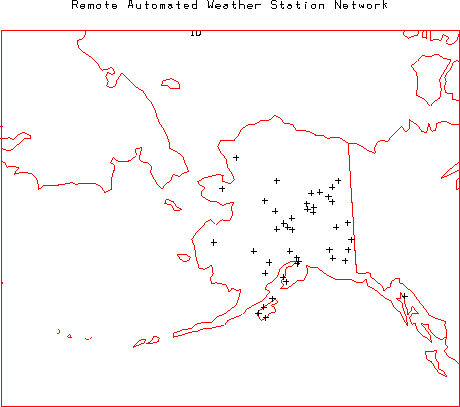
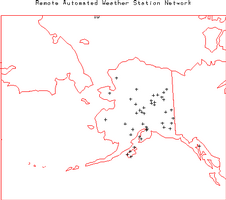
 Remote Automated Weather Station (RAWS) Network
 - The United States Forest Service oversees this network of stations owned and operated by state and local wildland fire agencies. The network typically provides hourly values of air temperature, dew point, relative humidity, wind speed, wind direction, precipitation, fuel temperature, and fuel moisture. The network consists of 726 stations located throughout the United States (42 in Alaska), but heavily concentrated in the forested areas of the western mountains. These data are included within the University of Utah
MesoWest and the NOAA/FSL
MADIS data sets. For further information visit the
USFS RAWS home page. The Western Region Climate Center has a
RAWS USA Climate Archive. The Alaska Fire Service also has a
Fire Weather Database.
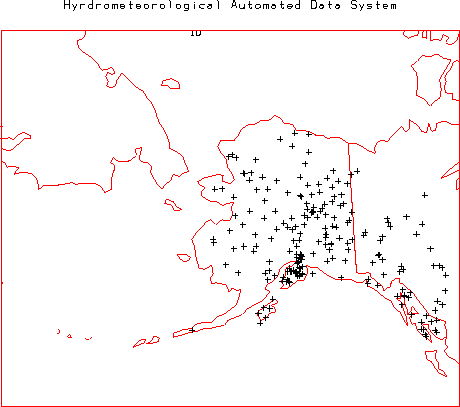
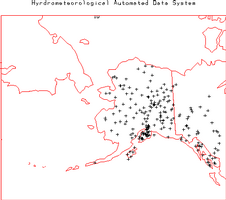
 Hydrometeorological Automated Data System (HADS)
 - The NOAA Office of Hydrologic Development operates the HADS real-time data aquisition and data distribution system. HADS collects data from Data Collection Platforms (DCPs) operated by a number of federal, state, and local agencies throughout the US and a few nearby countries. The network currently includes 10079 observation locations (180 in Alaska). The temporal resolution and parameters collected vary widely by network and station but can include a variety of meteorological and hydrologic parameters. For further information visit the
NWS HADS page.
 Why all the lies concerning the weather coverage of Alaska? Not as well covered as the lower 48, but, as these maps show, certainly covered well enough to know what the temperatures are in even the remote portions. And every agencies data shows the same thing, a very rapid warming, with the increase far higher than that for lower latitudes.