Bump your ass and go fetch.. Im out doing community service lighting 1000 luminary candles in a 15knot wind. Its beautiful...... Might keep the fire Dept busy tho.....
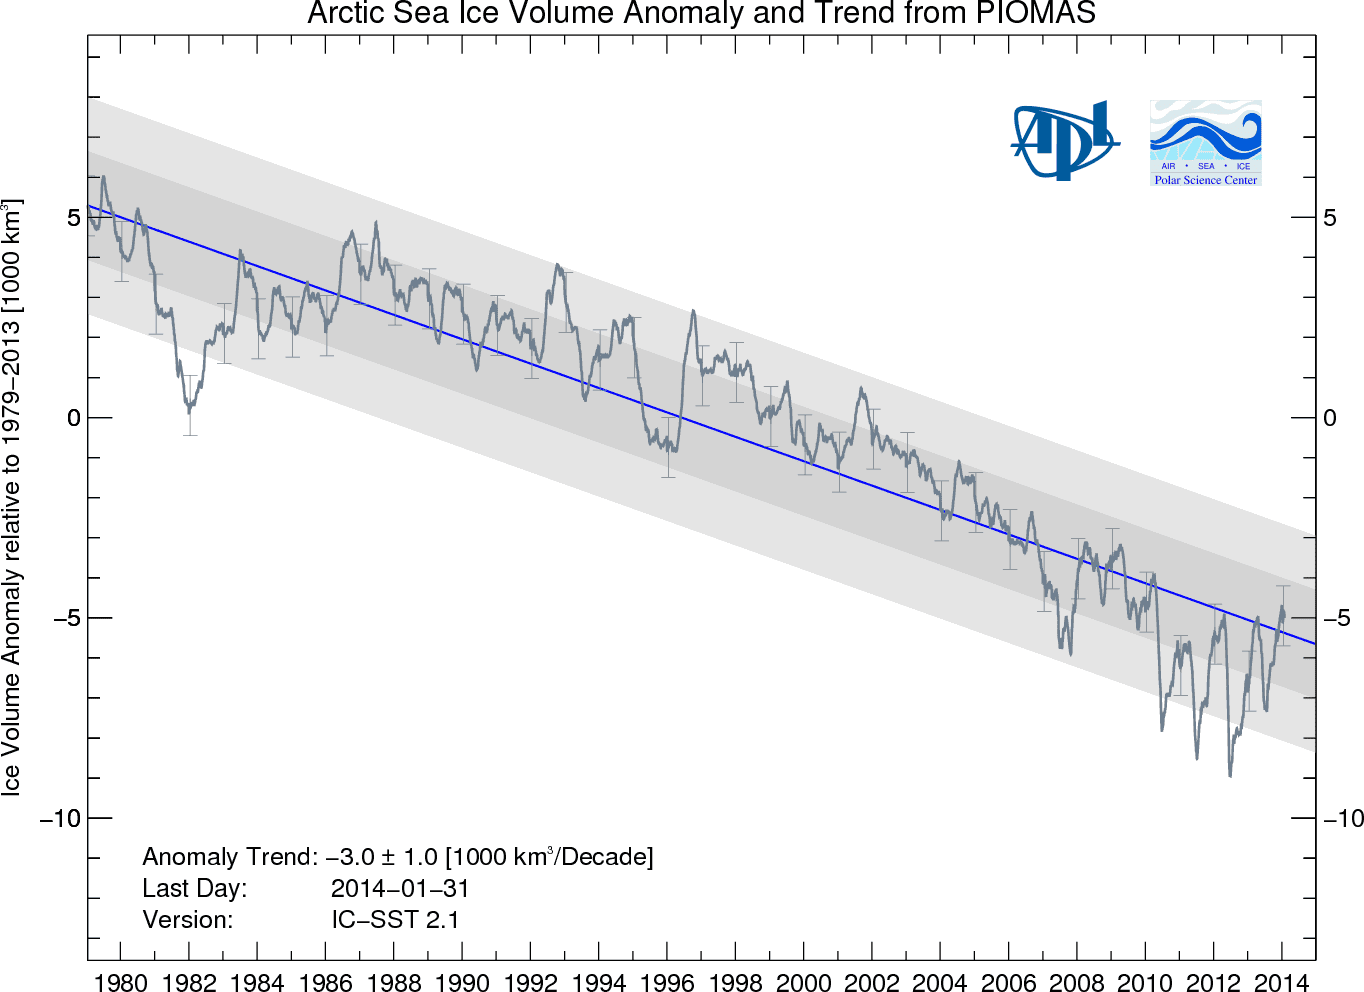
Got to telll ya Abe ---- A got a couple middle schoolers with mme that are real cllose to pulling up that chart info.. Think youre gonna lose this one.
Probably gave em too many clues already.
Fecalhead always claims that he has "
lots of evidence", or, even more idiotically, "
proof", to support the moronic denier cult myths and delusions that he posts, but he can never produce anything that actually qualifies as real evidence (and of course, there is no such thing as "
proof" in science, something he's too ignorant about science to comprehend). Usually he'll just give you an endless runaround when you ask to see any of it, like he's trying to do here, but occasionally he'll come up with some ridiculously fraudulent graph created on some denier cult blog by someone nitwit with no science background or degrees in science. After a while, you will come to realize that he has no conception of what actual 'evidence' is, so it is no surprise that he can't tell the difference between actual evidence and the fossil fuel industry propaganda that his puppet masters tell him is 'evidence'. He will nevertheless continually assure you that he is smarter and knows more than all of the actual climate scientists in the whole world, who, he is sure, are all engaged in a massive conspiracy to deceive everybody. He would be the poster boy for the
Dunning-Kruger Effect, if the walleyedretard had not got there first.