For you, sure.
EIA-914 monthly production report
NG - Feb 2021 production was 104,425 mil cubic feet per day. Dec 2021 it was 118,113 118113-104425=13688 13688/104425=12%. My bad for putting 14%.
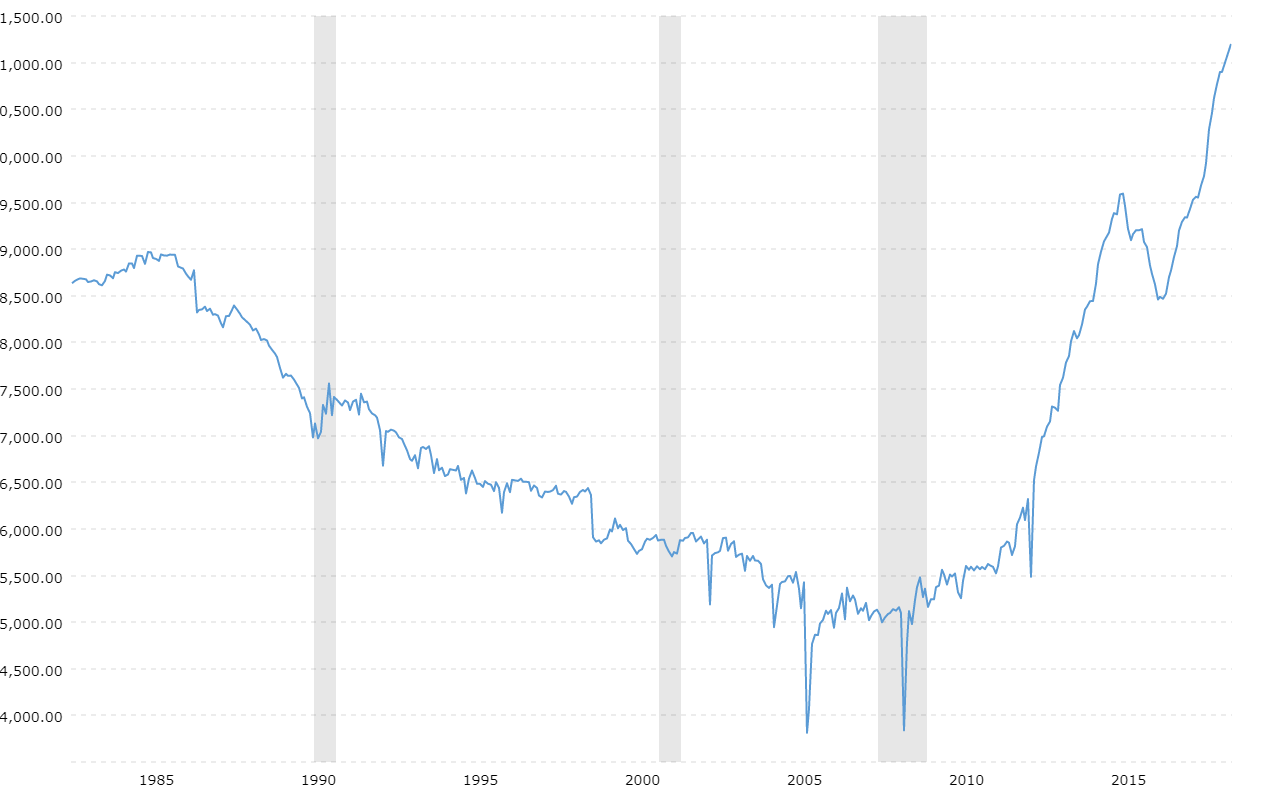
Interactive historical chart showing the monthly level of U.S. crude oil production back to 1983 from the US Energy Information Adminstration (EIA). Values shown are in thousands of barrels produced per day.

www.macrotrends.net
Feb 2021 production was 10,000,000 barrels per day. Feb 2022 it was 11,600,000. 11,600,000-10,000,000=1,600,000. 1,600,000/10,000,000=16%. ,