CDZ avoiding climate catastrophe : paying attention to our methane output should be of bigger concern to us, i and quite a few others think

Status
Not open for further replies.
Fascinating stuff, but BEFORE satellites, we had a VERY hard time even measuring absorption of solar radiance OR the relative POWER of different solar spectral bands at top of atmos.
True, it was difficult, but they at least checked themselves by comparing their models against their measured data so as not to just publish quackery like some people always do.

1638951456977.png
 
True, it was difficult, but they at least checked themselves by comparing their models against their measured data so as not to just publish quackery like some people always do.

View attachment 573137

As far as I can tell, you sweated for hours to find "The Light of Silvery Moon" to question whether CO2 was SATURATED.

Doesn't matter. It exponentially flattens the same way in which I can charge a capacitor to a voltage with resistor in the circuit. SAME CURVE. And trying to decide if the capacitor is "saturated" or not is foolish. There's so many time constants you incur before the additional charging is in the "3 zeroes to right of the decimal point".

And like the capacitor example, you'll have secondary effects like leakage over the long time span that may keep the capacitor from EVER being near saturation. For CO2 forcings, this time constant is in the 100 yr or so LONG TERM response to CO2 in the atmos IF emissions level or go down.
 

Scientists say this invisible gas could seal our fate on climate change​

By Rachel Ramirez, CNN
Updated 0208 GMT (1008 HKT) August 12, 2021

(CNN)Slashing carbon dioxide emissions is critical to ending the climate crisis. But, for the first time, the UN climate change report emphasized the need to control a more insidious culprit: methane, an invisible, odorless gas with more than 80 times more warming power in the near-term than carbon dioxide.
According to the UN Intergovernmental Panel on Climate Change, the concentration of methane in the atmosphere is higher now than any time in at least 800,000 years.
With Earth rapidly approaching the 1.5-degree-Celsius threshold above preindustrial levels, scientists say methane emissions need to be reduced fast. Charles Koven, a lead author of the IPCC report, said this is due to methane's incredible warming power.
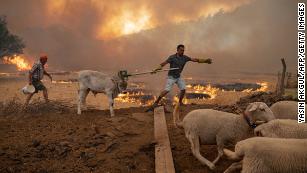
Earth is warming faster than previously thought, scientists say, and the window is closing to avoid catastrophic outcomes
"The fastest way that we might mitigate some of the climate change that we're seeing already in the short term is by reducing methane," Koven told CNN. "If we were to reduce methane emissions, it would act to offset one of these sources of warming."
If the world stopped emitting carbon dioxide tomorrow, Koven said, global temperatures wouldn't begin to cool for many years because of how long the gas stays in the atmosphere. Reducing methane is the easiest knob to turn to change the path of global temperature in the next 10 years, he said.
Methane, the main component of the natural gas we use to fuel our stoves and heat our homes, can be produced in nature by belching volcanoes and decomposing plant matter. But it is also pumped into the atmosphere in much larger amounts by landfills, livestock and the oil and gas industry.

Natural gas has been hailed as a "bridge fuel" that would transition the US to renewable energy because it is more efficient than coal and emits less carbon dioxide when burned. Importantly for industry, natural gas is in abundant supply around the world and is less costly to extract from the ground.


But proponents for this new "cleaner" gas missed a dangerous threat: that it could leak, unburned, into the atmosphere and cause significant warming.
Methane can leak from oil and natural gas wells, natural gas pipelines and the processing equipment itself. According to data from the US Energy Information Administration, the US has thousands of active wells for natural gas, millions of abandoned oil and gas wells, about two million miles of natural gas pipelines, and several refineries that process the gas.
One in three Americans lives in a county with oil and gas operations, posing climate and public health risks, according to a report by the Environmental Defense Fund.

Until recently, tracking the location and magnitude of methane leaks was difficult. Now, infrared cameras and advanced satellites can estimate methane emissions around the globe, giving scientists and regulators insight into what's being released from facilities.
Climatologists at NASA and the National Oceanic and Atmospheric Administration previously told CNN that pernicious changes in the climate system will only intensify unless people stop using fuels that burn and leak greenhouse gases like methane.
"For carbon dioxide, we've always known about power plants and smokestacks and things like that; but with methane, until recent years, we didn't understand how much an influence a small number of large sources have really had," Robert Jackson, professor of environmental science at Stanford University, told CNN. "We didn't understand how long the tail was and how important the super-emitters were for reducing emissions."
The latest IPCC assessment highlights that scientists now have a better understanding of how much methane is being released by human activity like agriculture and the fossil fuel industry, and how much it contributes to the climate crisis.

Around the world, fossil fuels, agriculture and coal mining are skyrocketing methane emissions. Nonetheless, the production and sources vary by region. In the North America, a majority -- 14% of total methane emissions -- come from the oil and gas production followed by livestock at 10%. In China, coal mining is the biggest methane driver, contributing 24% to total emissions.
Though agriculture is a major source of methane, Jackson said the emissions from farming and food production would be harder to tackle.
"There are only certain things we can do with cattle," Jackson said. "We can either ask people to stop eating beef or we can try and give cattle feed additives to change the microbes in the chemistry of their guts. But that's not easy to do for billions of cattle around the world."
The International Energy Agency estimate that the oil and gas industry around the world can reduce methane by 75% using the technology already available. It also estimates that 40% of the emissions could be reduced without extra costs, since the natural gas captured could then be sold.
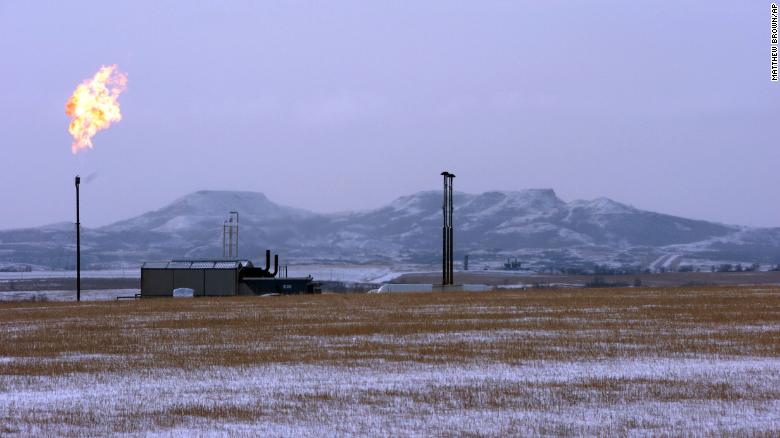
Flaring at a natural gas processing facility in North Dakota.


Flaring at a natural gas processing facility in North Dakota.
Climate activists like Lisa DeVille, a member of the Mandan, Hidatsa, and Arikara Nation, are urging policymakers to make stringent methane reductions. The Bakken oil field in North Dakota surrounds the Fort Berthold Indian Reservation, where DeVille lives, with nearly 1,000 oil and gas wells that scientists found in 2016 was leaking 275,000 tons of methane per year.
"This means the land that is part of my identity as an Indigenous woman has been turned into a pollution-filled industrial zone," DeVille said. "This is unacceptable."
As the co-founder of the grassroots group Fort Berthold Protectors of Water and Earth Rights, DeVille is tackling environmental regulations head-on. In 2018, the organization successfully sued the Trump administration's Bureau of Land Management for rolling back a critical methane waste prevention rule.
Global temperatures are now at 1.1 degrees Celsius above pre-industrial levels, according to the report, and the planet is already seeing the impact in the form of extreme fire behavior, severe flooding, relentless drought and deadly heat waves.
The IPCC report makes clear that stopping methane emissions is key to slowing the planet from reaching 1.5 degrees. Scientists say world leaders need to act immediately in tackling all greenhouse gas emissions, and not just carbon dioxide.
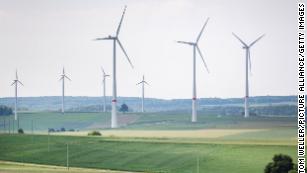
Climate scientists have done their bit. Now the pressure is on leaders for COP26.
Rick Duke, senior director and White House liaison for John Kerry, President Biden's special climate envoy, told CNN in a press call that reducing methane, and methane leaks, is a top priority for the Biden administration.
"There's been incredible largely behind-the-scenes effort already to prepare to move faster and more comprehensively to cut methane domestically, at the same time that we're addressing this as a diplomatic imperative," Duke said.
Already, pressure is mounting. In June, DeVille discussed tribal issues, particularly slashing methane emissions and transitioning to clean energy quickly and equitably, with Environmental Protection Agency Administrator Michael Regan.
"What we do in the next few years will determine what kind of world we have, what kind of world we leave for our children," said DeVille, who is now seeking to meet with Interior Secretary Deb Haaland to discuss similar issues. "We must rapidly switch to clean energy, stop fossil fuel carbon pollution, and then methane leaks."
CNN's Drew Kann and John Keefe contributed to this report.

My question, especially to the Republican audience and leaders that frequent this forum, is this :
Would you allow Biden to curtail the US' methane output, and with that set an example for the rest of NATO and the world?
An example that by the way would increase world-wide goodwill for the USA.


Setting the example means the US taking the biggest financial hit and funding the majority of world wide efforts to kill our economy. Meanwhile China keeps churning out coal fired power plants and every poor nation gets a pass.

This isn't about climate change it's about transferring wealth to the poor countries. Killing the middle class and the elite going on with no change to their life style.
 
As far as I can tell, you sweated for hours to find "The Light of Silvery Moon" to question whether CO2 was SATURATED.

Doesn't matter. It exponentially flattens the same way in which I can charge a capacitor to a voltage with resistor in the circuit. SAME CURVE. And trying to decide if the capacitor is "saturated" or not is foolish. There's so many time constants you incur before the additional charging is in the "3 zeroes to right of the decimal point".

And like the capacitor example, you'll have secondary effects like leakage over the long time span that may keep the capacitor from EVER being near saturation. For CO2 forcings, this time constant is in the 100 yr or so LONG TERM response to CO2 in the atmos IF emissions level or go down.
I don't recall sweating. However, I generally do spend some time researching things to make I'm not missing anything significant that might be new. And I usually do respect your responses.

I found nothing in this case, but did glean much more about where and when this line of argument began and how little it's changed since. CO2 saturation is the argument you're now both backing away from and continuing to argue here.

My source reveals not just how old and tired this very line of attack truly remains, but how thoroughly it was debunked from the start. That you and your ilk simply continue applying lipstick to the same old duds before relaunching testifies to your stubbornness if nothing else.
 
Just a few months ago I had occasion to bring some electronics to a "landfill" for recycling. Noticed that the pit for general rubbish and a separate "honey bucket pond" were covered with a thick plastic sheet. The one operator on site explained that they're looking ahead. As the junk and crap rots it produces methane. The plastic is meant to contain it. They plan to then drive old-fashioned well points and suck the gas out to use for home heating.

Yeah, it IS a small town with no municipal sewage plant. Primarily old-fashioned cesspools that are pumped periodically. The outlying places that used to have outhouses (pit toilets) are quickly shifting over to 5-gallon pails lined with plastic bags that then get emptied into the "pond" as an investment in future warmth.

Now.

Where does one buy a plastic sheet big enough to cover San Francisco?
 
I don't recall sweating. However, I generally do spend some time researching things to make I'm not missing anything significant that might be new. And I usually do respect your responses.

I found nothing in this case, but did glean much more about where and when this line of argument began and how little it's changed since. CO2 saturation is the argument you're now both backing away from and continuing to argue here.

My source reveals not just how old and tired this very line of attack truly remains, but how thoroughly it was debunked from the start. That you and your ilk simply continue applying lipstick to the same old duds before relaunching testifies to your stubbornness if nothing else.
Name one prediction that’s come true?
 
I found nothing in this case, but did glean much more about where and when this line of argument began and how little it's changed since. CO2 saturation is the argument you're now both backing away from and continuing to argue here.

I never CLAIMED anything was saturated and cant produce further warming. You got the wrong guy to argue with on this. I think that's a Billy_Bob argument. LOL.

And there's no disputing the "doubling" construct that I presented. It's FUNDAMENTAL to GW science. You'll find it used in EVERY PAPER on "transient and steady state" surface warming responses to increases in Atmos CO2. Which papers are discussing "linear and non-linear" systems theory. Something I got pretty good skills at.

Not backing away. Don't want to get into an argument about whether/when a system with logarithmic declining response gets "saturated". Which is all your SKETCHY source wanted to argue.

It IS what IT IS. And you'll find that curve ALL OVER the GW lit.. Dont have to go pawing into "By the Light of the Silvery Moon" with all it's centuries of historical science and ABSURD analogies to picking colored M&Ms off a conveyor belt.

If you want to check me on this, I'll give you the "yellow brick roadmap". When I used 1.1DegC for each doubling of CO2 atmos conc, THAT -- is the calculation done in Atmos Physics books based simpluy on GEOMETRY, physics and chemistry of CO2 in the Greenhouse.

There is a holy grail in Climate Science called "climate sensitivity" that take the CO2 forcing POWER and turns it into a surface temperature that REPLACES my 1.1DegC example.

It's a simple constant that's arrived at by studying the transient/steady state MODELING of atmos response. Since this turd of a circus began. THAT NUMBER has changed from 4 or 6 (DegreesC) down to 2.5 or even 1 lately. As the models got BETTER -- this vital central number has come DAMN CLOSE to the "simple back of envelope" 1.1DegC.

IN ALL of these papers -- they estimate WHERE we are on the log function, take into account all the GW feedbacks and variables and ENHANCE that simple ass estimate that I gave. AND IMPORTANTLY -- they ALL USE a "power of 2 flattening" curve to model the POWER of CO2 to warm. Meaning TWICE the previous amount to achieve the next "doubling".

Here's the relevant history to how we went from "HAIR ON FIRE, WE"RE ALL GONNA DIE" to "Well we should maybe do something about this"..


I'm BTW a "luke warmer" somewhere below the "Throw money and fix it NOW folks. :biggrin:

Climate-Sensitivity-Value-Estimates-Update.jpg
 
Last edited:
I never CLAIMED anything was saturated and cant produce further warming. You got the wrong guy to argue with on this.
Never said you did. Posting Clive Best's bullshit graph back here w/o attribution was revealing enough. Continuing to pound the table with stuff like

"the "doubling" construct that I presented. It's FUNDAMENTAL"

just cements it. I'll remind you that you initially described the decrease as both logarithmic and exponential. Other numbers reappear because they seem to strike you as REALLY COMPELLING in and of themselves, like "1.1"! Now you're pushing a simple x2 exponential decay. Make up your mind.

You make up excuses to dismiss a scholarly reference, oft cited by actual climate scientists. No doubt because it so thoroughly debunks your ALARMED notions of CO2 powerlessness. Unfortunately, I'm sure this sort of "SKETCHY", "ABSURD" tossing and screaming from the peanut gallery has influenced many scientists to FREAK OUT a bit and discuss this "Flattening" "Sensitivity" just to somewhat appease all you STOMPING monkeys. Pro-tip: Your most recent image depicts only linear declines, btw. You may need to brush up on your algebra ;)
 
Last edited:
Never said you did. Posting Clive Best's bullshit graph back here w/o attribution was revealing enough. Continuing to pound the table with stuff like

Didn't need to take that from Clive Best. It exists EVERYWHERE in GW papers and lit in that shape with maybe a simple tiny change to the constant multiplier depending on whether you're using the "simple ass" chem/physics calculation or the results of MODELING that take into account the other estimated variables in surface warming from CO2 in the GHouse. Hardly know who Clive Best is in fact.

Not making any of this up. Read my sigline quote from Shaw. Had it for decades. Here's the logarithmic equation for CO2 watts/m2 forcing function based on concentration from an atmos physics book. When C doubles -- the C/Co becomes 2. So it's ln(2).

CO2force.png


Go stick that in Excel with C/Co running from 0 to beyond and you'll get the ORIGINAL graph I posted. LOL...
ln(2) X 5,35 = 3.7 Wm2. That's the additional POWER at the surface for a DOUBLING of CO2. (about 1 or 2 incandescent Xmas tree bulb per sq meter).. Climate Sensitivity numbers build on THAT thru modeling of a real atmos and feedbacks to convert that to a temperature instead of a power figure - by finding a conversion multiplier to change the power forcing to temperature.

(It's a bit more complex than that because they have short term and long term estimates of the constant they multiply the equation above by. And in fact, the whole estimate is continuously time dependent and varies with different regions of the earth.)

"the "doubling" construct that I presented. It's FUNDAMENTAL"

just cements it. I'll remind you that you initially described the decrease as both logarithmic and exponential. Other numbers reappear because they seem to strike you as REALLY COMPELLING in and of themselves, like "1.1"! Now you're pushing a simple x2 exponential decay. Make up your mind.

Because it IS fundamental. You've misinterpreted that last graph I put up.. The dots are PAPERS on estimates of climate sensitivity by YEAR. That's the numbers that the MODELS produce to replace my 1.1DegC per doubling. THOSE PAPERS use the time constant of a "doubling" of CO2 - just as I did. It's a graph of HOW REDUCED the climate science ESTIMATE OF POWER OF CO2 to warm the surface has become since the "hair on fire -- Earth is screwed" 1990s or so as estimated by the models.. Meaning that, all the stuff the MODELS ADD (like clouds, feedbacks, etc) have been producing LOWER AND LOWER ESTIMATES of the power of CO2 to warm the surface over time.


No doubt because it so thoroughly debunks your ALARMED notions of CO2 powerlessness.

Never said that. Just using the right equation for CO2 ability to force temperature at the surface. You know the one that 94% of climate scientists ACCEPT.. LOL,

nd screaming from the peanut gallery has influenced many scientists to FREAK OUT a bit and discuss this "Flattening" "Sensitivity" just to somewhat appease all you STOMPING monkeys. Pro-tip: Your most recent image depicts only linear declines, btw. You may need to brush up on your algebra

Hoped that you'd recognize what was IN that graph without wearing out my fingers. Explained all that misconception above.

Nice rant tho.. LOL...
 
Last edited:
Touché.

Didn't need to take that from Clive Best. It exists EVERYWHERE in GW papers and lit in that shape with maybe a simple tiny change to the constant multiplier depending on whether you're using the "simple ass" chem/physics calculation or the results of MODELING that take into account the other estimated variables in surface warming from CO2 in the GHouse. Hardly know who Clive Best is in fact.
Well, neither did I. But Google suggested Clive first, and he has sufficient credentials to earn benefit of doubt regarding following professional publishing etiquette. He did not, in fact, credit anyone else for that exact same chart, title and all. Sure, he could have just passed off someone else's product as his own, and that wouldn't really surprise me much given his bent stances, but I'd still bet a $ that it really is his work. So, if nothing else, I'm informing you of its most likely origin, which I can only hope makes you squirm a little. More to come..
 
Before moving on, not trying overstate the obvious, but while stating "MODELING" so clearly like that, I can't help thinking that should give one some pause. Okay, self, we're just talking about MODELS here, not real, measured results.. MODELS of what exactly?.. Reality?.. Is this necessary?.. Am I really working toward making some useful point?.. Anyways..
Not making any of this up. Read my sigline quote from Shaw. Had it for decades. Here's the logarithmic equation for CO2 watts/m2 forcing function based on concentration from an atmos physics book. When C doubles -- the C/Co becomes 2. So it's ln(2).

CO2force.png
I'd be impressed if you had figured out to type that shit out here instead of just copy/pasting the image. And I'm so not going back to enabled sig lines just to read yours, but nice self-promotion. So it's ln(2), eh? Final answer?.. Cool! Have I argued that "logarithmic equation for CO2 watts/m2 forcing function based on concentration" should be otherwise? Uh,.. no.. ??? That similar graphs were hard to find on the web? Uh,.. no.. ???
Go stick that in Excel with C/Co running from 0 to beyond and you'll get the ORIGINAL graph I posted. LOL...
No, I won't and you know it. The labelling is what's really telling.
ln(2) X 5,35 = 3.7 Wm2. That's the additional POWER at the surface for a DOUBLING of CO2. (about 1 or 2 incandescent Xmas tree bulb per sq meter).. Climate Sensitivity numbers build on THAT thru modeling of a real atmos and feedbacks to convert that to a temperature instead of a power figure - by finding a conversion multiplier to change the power forcing to temperature.

(It's a bit more complex than that because they have short term and long term estimates of the constant they multiply the equation above by. And in fact, the whole estimate is continuously time dependent and varies with different regions of the earth.)
Right,.. it's all really complicated.. Try reading this through with no pain medication..

But let's stop and examine how that "additional" caveat you inserted might really apply. In addition to what now? Some climate experts assert the following:
Our research suggests that the likely ECS range is 2.6C to 4.1C, with a best estimate of slightly above 3C. Outside this range, we find a less-than-5% chance that ECS is below 2C and a 6-18% chance it is above 4.5C.

We also produced an estimate for “effective climate sensitivity” – a slightly different measure from ECS – of 2.6 to 3.9C. (ECS is a warming estimate once the climate has reached equilibrium after CO2 levels are doubled. This is sometimes impractical to assess and simulate because the climate can take thousands of years to truly reach equilibrium. Effective climate sensitivity is a common workaround, which typically extrapolates the warming 150 years after a doubling of CO2.)
And there's your cue.. Grab the final word. Go ahead and tell everyone, "Like I said, (blaa, dee blaa, dee blaa..)" You know you can't resist parading around like peacock in heat :beer:
 
I don't recall sweating. However, I generally do spend some time researching things to make I'm not missing anything significant that might be new. And I usually do respect your responses.

I found nothing in this case, but did glean much more about where and when this line of argument began and how little it's changed since. CO2 saturation is the argument you're now both backing away from and continuing to argue here.

My source reveals not just how old and tired this very line of attack truly remains, but how thoroughly it was debunked from the start. That you and your ilk simply continue applying lipstick to the same old duds before relaunching testifies to your stubbornness if nothing else.
WOW... Denying empirically observed science... You're having a real hard time with this.

CO2 is saturated in our atmosphere. Over 95% of the potential warming directly from this GHG is expended. Even when the atmosphere was upwards of 7,000ppm we did not create a runaway affect.

The "multiplier" of affect (climate sensitivity number) Currently sits at 0.49732 (0.5). This means the warming expected of 1.1 deg C from CO2 alone is being dampened. CO2 is acting as an energy reducer (enabling escape of energy from earths climatic system.)

It seems like you're having a real hard time with the basic premise of CAGW. Read this link and get a bit more information on the basics of the theory. The Skeptic's Case | David M.W. Evans
 
I never CLAIMED anything was saturated and cant produce further warming. You got the wrong guy to argue with on this. I think that's a @Billy_Bob argument. LOL.

And there's no disputing the "doubling" construct that I presented. It's FUNDAMENTAL to GW science. You'll find it used in EVERY PAPER on "transient and steady state" surface warming responses to increases in Atmos CO2. Which papers are discussing "linear and non-linear" systems theory. Something I got pretty good skills at.
ITs a very basic premise that can easily be shown through empirically observed evidence. While there can be other factors, the empirical evidence shows they are all acting as dampeners and releasing energy from the climatic system.
 
ITs a very basic premise that can easily be shown through empirically observed evidence. While there can be other factors, the empirical evidence shows they are all acting as dampeners and releasing energy from the climatic system.

Publish your paper yet?
 
That similar graphs were hard to find on the web? Uh,.. no.. ???

Might be a little hard to find unless you wade thru the papers. And even THEN, when you give an equation for Ln() function in a paper -- you dont NEED to graph it for your audience. But it's been IN the IPCC reports from the UN. And here's a paper about EVERYTHING on calculating the REAL POWER Of CO2 (and some weird ass adjunct assumptions about its POTENTIAL "superpowers".) Table 6.2 lists the forcing functions for several GHouse gases.


You CANT make projections of ANY WORTH about GLOBAL temperature futures WITHOUT MODELING. Modeling is NEVER exact. It's actually more of a "thinking tool" or what-if scenario generator. My simplication ignores things like clouds, deviations from normal humidity, and all manner of feedbacks in the system,

You can't process the HUGE thermodynamics of a complex planet WITHOUT them. And they are GETTING a bit better, but have sucked on projections just 20 years out. We've only HAD tools like these for about 3 decades anyways.

I just find it interesting that all those EARLY "Doom and Destruction" models calculating the expected change in temp -- of which the CLIMATE SENSITITIVY number(s) are the key variable, have COME DOWN over at least past 20 yrs by mayber a factor of 3, And SURPRISE !!! That puts the latest estimate in the same general range as the "dumbass" crude version that existed BEFORE modeling. That's because all those CATASTROPHIC "superpowers" of CO2 that early activists in labcoats fed into the models just have been proven wrong by 30 years OF REAL DATA from satellites and other instrumentation. Which is why I ACCEPT GLOBAL WARMING and attribute a major share of that to MAN -- but I reject all these adjunct end times theory about "trigger temps" and "12 years to save the planet" crao that is STILL Reliant on those early models.

Dont know if you were following GW science back to the 90s, but EVERY WEEK there would SCREAMING HEADLINES about a "new study" - giving us less time to survive. Those dont happen anymore. You'll never hear the words -- "The last 30 years of instrumention data CONFIRMS "runaway global warming" or "trigger points" 0r any of that other Catastrophic stuff.

I'm wordy on this because i write political position papers for Independent candidates on the topic. I take the RESPONSIBILITY to "get it right". And writing helps CHECK my assumptions and facts.
 
CO2 is saturated in our atmosphere. Over 95% of the potential warming directly from this GHG is expended. Even when the atmosphere was upwards of 7,000ppm we did not create a runaway affect.

Dont let that graph get the "Clive Best" of you. :auiqs.jpg: Of COURSE if you start from ZERO concentration -- you ARE SATURATED in that 95% number.

But the ZERO NUMBER never existed.. In fact, since the last ICE AGE (and b4 SUVs and coal plants) -- we START from about 280ppm. Because in naive way -- that's the IDEAL conc of CO2 before man started to raise cows and pigs and built factories.

So - We haven't ever REACHED the FIRST DOUBLING in atmos from there. The radiative forcing from IDEAL to NOW hasn't accounted for more than a couple WATTS of power at the surface.

BUT -- 3 or 5 watts of "averaged incident power" increase CAN ACCOUNT for MANY degrees of surface warming. (like 1.5 to 3.0 say).

And when we REACH the first doubling -- it will take TWICE AS MUCH CO2 to get the NEXT 1.5 to 3.0DegC doubling -- BUT IT WILL HAPPEN..

There's no doubt of that. But likely that 2nd doubling is in the latter part of the NEXT century and our ancestors will be too dumb to even see it coming if we dont IMPROVE REAL Science/math/tech/eng education.
 
Status
Not open for further replies.

Forum List

Back
Top