Posting daily actual temperature that make it very difficult to see how ice could possibly be melting is a threat to your fictional narrative, altered data and temperature models.
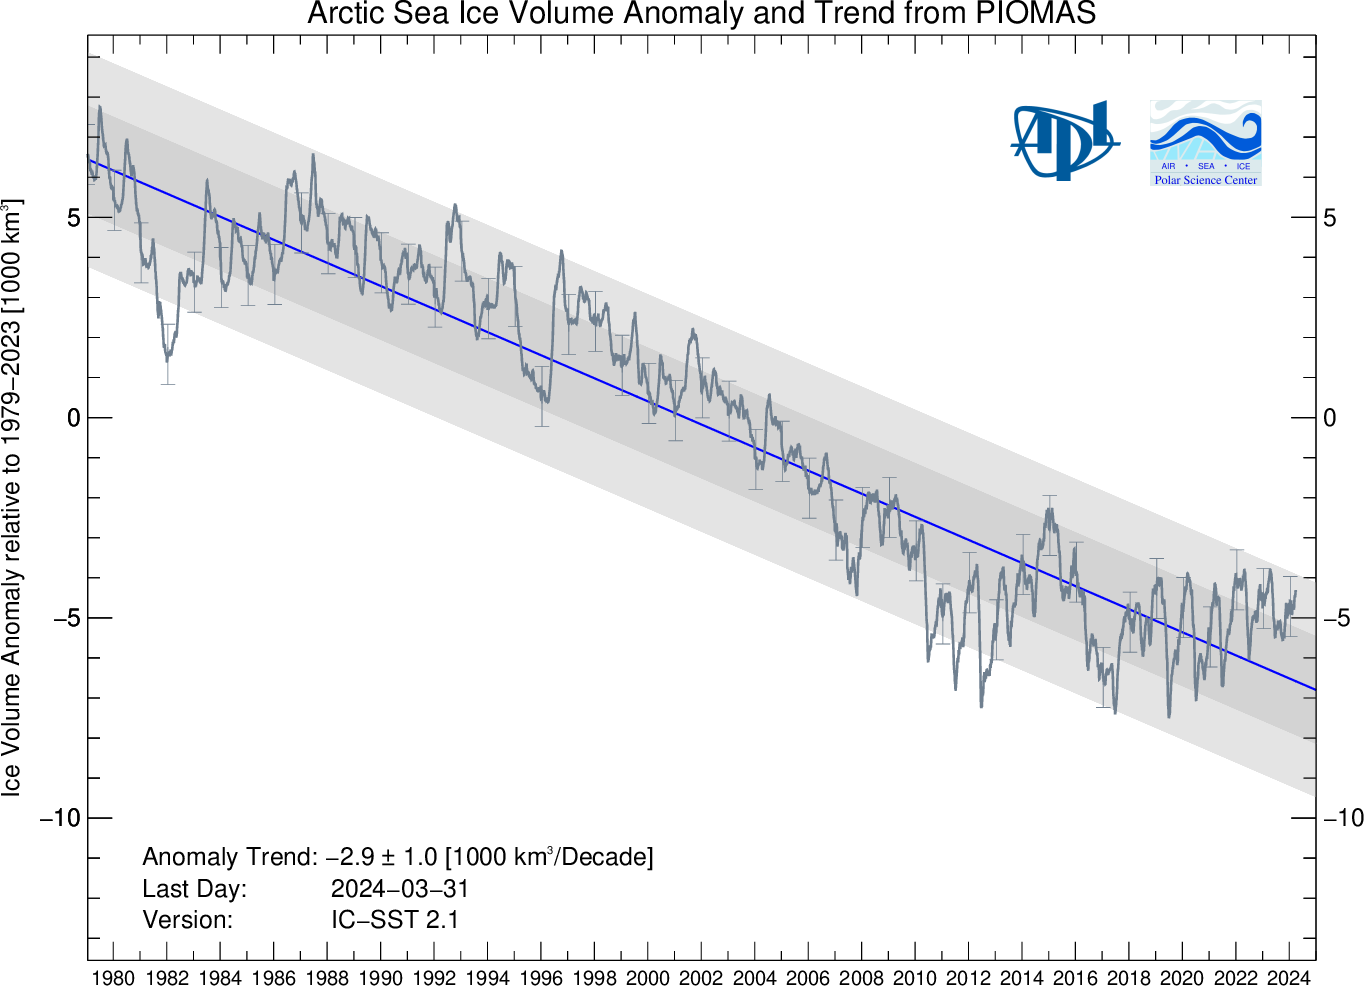
No one could be as stupid as you seem to be trying to appear. The ice extent goes up in the winter, Frank, and down in the summer. And as the data show, it has been consistently going down more than up. The volume of the Arctic ice cover has been steadily decreasing for 30 years and will likely hit zero for the first time around 2030 per the data trends. That zero ice period will get longer and longer till our great grandchildren will know the Arctic as a chilly northern ocean.
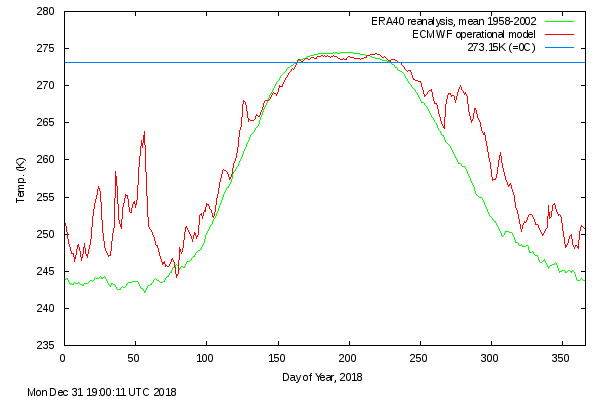
All I do is post the actual temperature over areas separate by thousands of miles covering 1.4 million square MILES of the Arctic. The temperature peak at maybe 4F at noon in only one area and are generally around minus 20F. I'm just trying to understand how it is you Warmers continue to post goofy charts showing red temperature "anomalies" as if its something meaningful
And you want to silence me? That's Fascism, that's EnviroMarxism, that's NOT science. Post all the fake data and flawed models you want, I encourage the debate
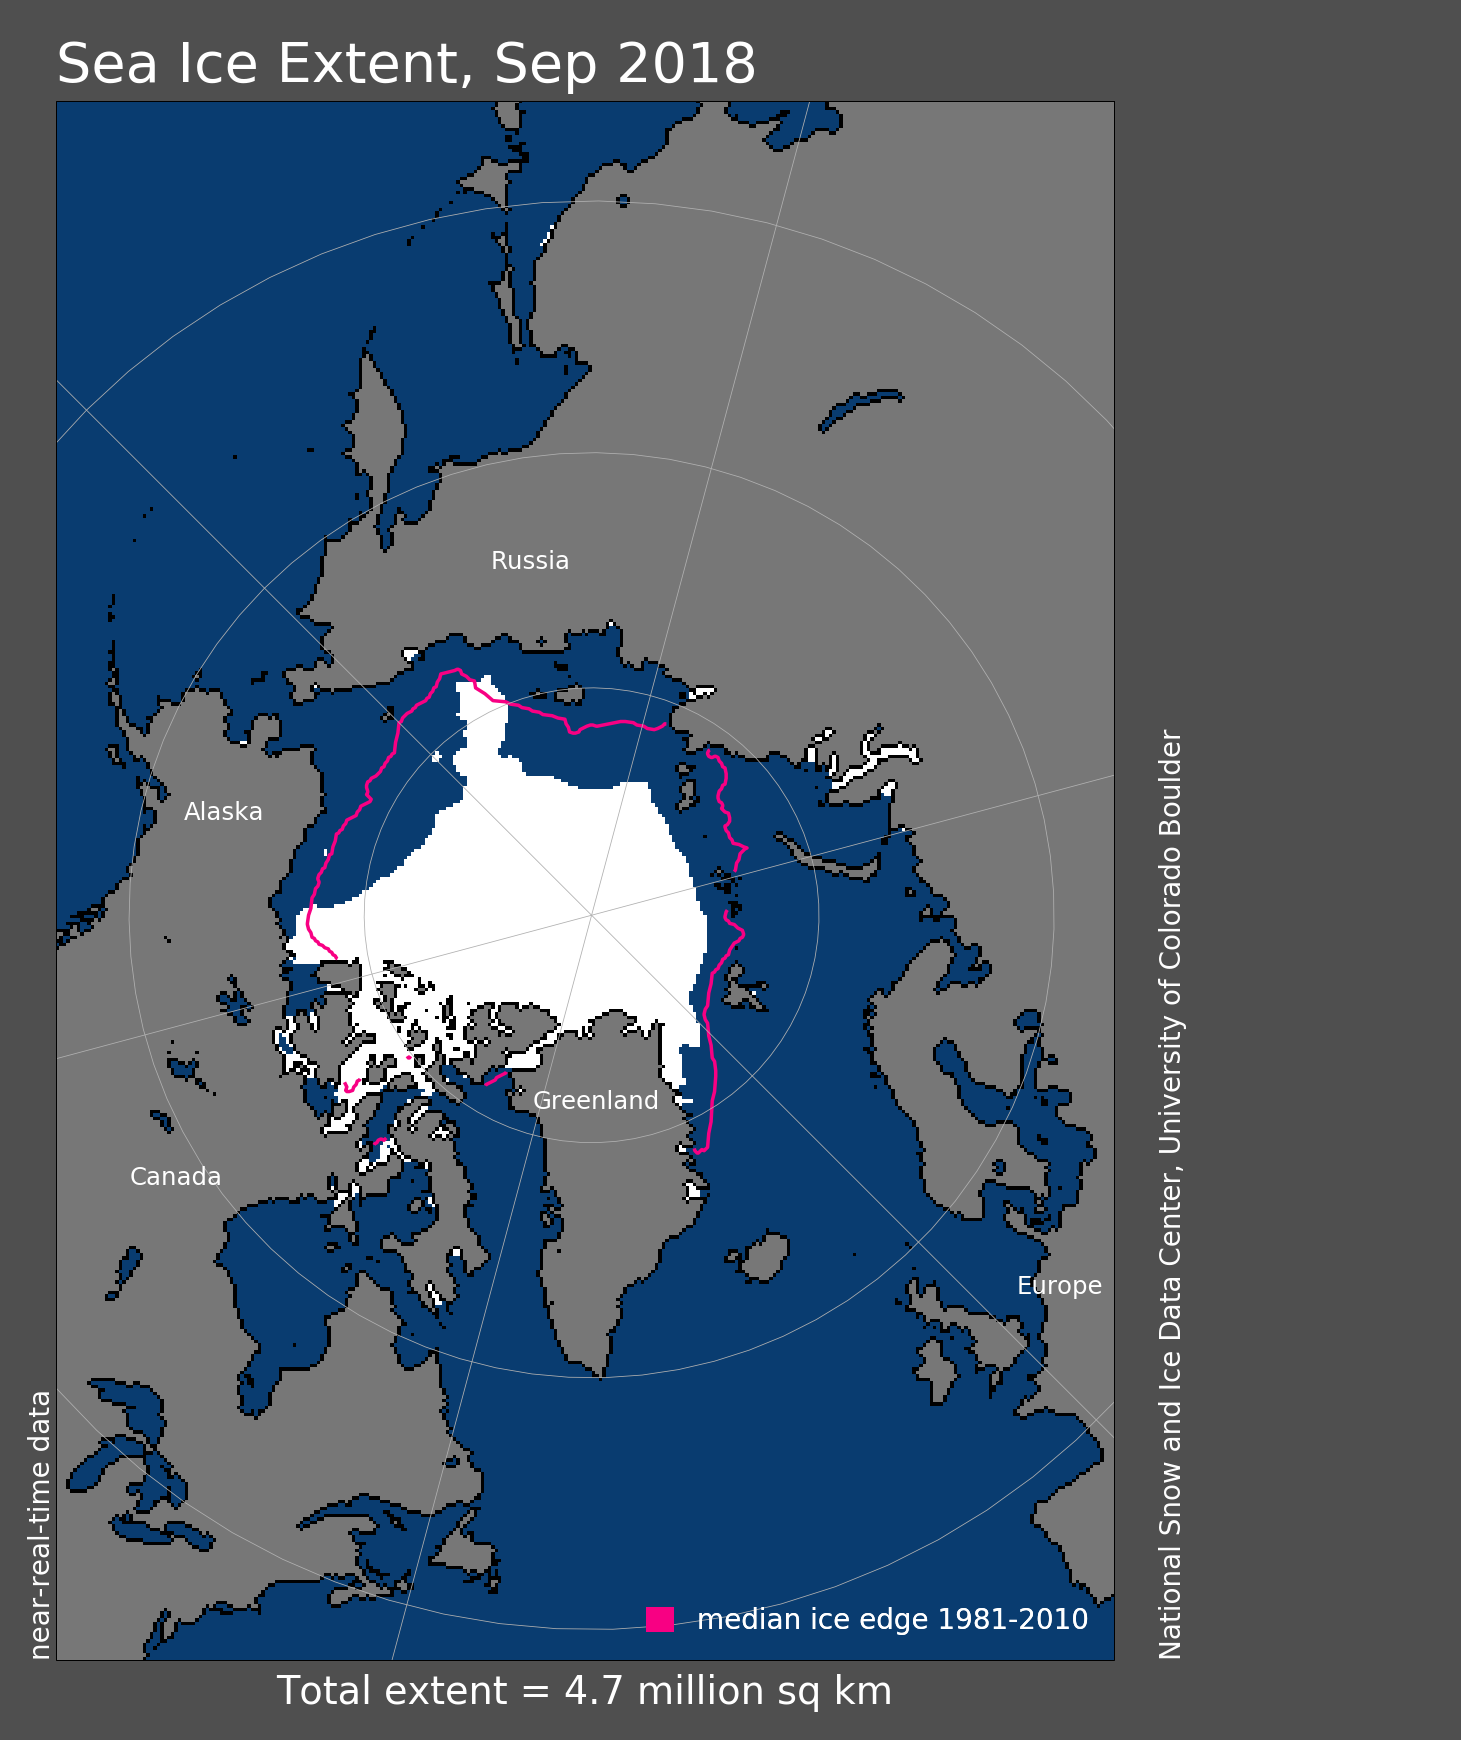
I have not been posting temperature charts in this thread Frank. I've been posting OBSERVATIONS of the area and volume of the Arctic ice cap - the thing we're actually supposed to be talking about. If you find them "goofy" then perhaps this topic is just a little too advanced for your educational level.
A 5-year old child would understand this Frank. You can spell and operate a computer. I have to assume that you are smarter than you are trying to appear. Water freezes in the winter and melts in the summer. Got that Frank? What happens if it freezes more than it melts? The ice would increase. What happens if it melts more than it freezes? The ice would decrease. Well, Frank, it has been melting more than it has been freezing at least since 1979 (the start of satellite data). The ice cap has been decreasing.
And if you come back on this again, I won't be responding. You're a troll, Frank. Virtually all the deniers here have become trolls, It's all they can do.
A 5-year old child would understand this Frank. You can spell and operate a computer. I have to assume that you are smarter than you are trying to appear. Water freezes in the winter and melts in the summer. Got that Frank? What happens if it freezes more than it melts? The ice would increase. What happens if it melts more than it freezes? The ice would decrease. Well, Frank, it has been melting more than it has been freezing at least since 1979 (the start of satellite data). The ice cap has been decreasing.
A 5-year old child would understand this Frank. You can spell and operate a computer. I have to assume that you are smarter than you are trying to appear. Water freezes in the winter and melts in the summer. Got that Frank? What happens if it freezes more than it melts? The ice would increase. What happens if it melts more than it freezes? The ice would decrease. Well, Frank, it has been melting more than it has been freezing at least since 1979 (the start of satellite data). The ice cap has been decreasing.
You have been shown that the ice extent and volume have cycled up and down for the entire record. There are several periods one could cherry pick and claim the decline has stopped, but it hasn't. The temperature data certainly give you no reason to believe the decline has stopped.
Less melting this year, but a great deal less freezing as well.
Whoa, fool. It's increasing no where near the rate it increased between 1981 and 1987. What happened? Jesus, your desperation is starting to make me cringe.
Whoa, fool. It's increasing no where near the rate it increased between 1981 and 1987. What happened? Jesus, your desperation is starting to make me cringe.
Whoa, fool. It's increasing no where near the rate it increased between 1981 and 1987. What happened? Jesus, your desperation is starting to make me cringe.
Speaking of fools.. The fool posts and fails to recognize a change in average after a long bottom out... Obviously you have no concept how a sign wave looks or how the climatic response is normal and natural..