Sun Devil 92
Diamond Member
- Apr 2, 2015
- 32,078
- 11,117
- 1,410
- Banned
- #41
The climate changes.....
OMG
OMG
Follow along with the video below to see how to install our site as a web app on your home screen.
Note: This feature may not be available in some browsers.
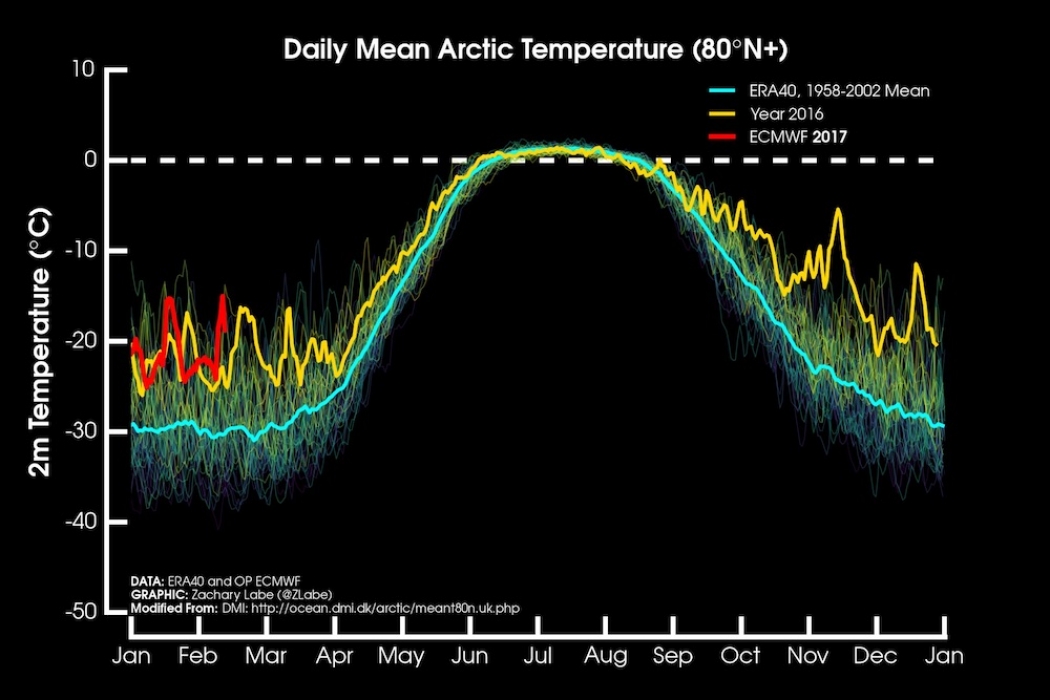
How many years ago were you first told that weather isn't climate? What does this graphic tell you? In particular, read the temperatures for December 14th.
God are you stupid
Silly ass, I am hardly panicking on a daily projected variance. What I am doing is showing that every day, we are higher than the average in the past, and that, excepting a major volcanic eruption or impact, we will be warmer in the future than our average will be today. And I have watched this site for a while now, looking at local temperatures compared to what they show, and, thus far, they have been dead on. In fact, I have not seen one of you fellows even try to deny that. All you will do is say that it is a daily projection. Which is the truth, a daily projection that has been very accurate. You have a fancy way of lying.
Again -- with the "RE-analyzer" shit???
From UAH data using ARCTIC ONLY...
2018 08 +0.09
2018 09 +0.21
2018 10 +1.11
2018 11 +0.69
Even using the 20th century avg rather than the Satellite era avg to GET the anomaly number would only bias those numbers up by about 0.5Deg...
You're looking at weather. And ONLY the climate reanalzer's PROJECTED temperatures using their modeling and their initial conditions and parameters.
The normal daily variance in the Arctic is the HIGHEST on the globe. My variance in early winter in Tenn is about +/- 6 or 8 degF. In the ARCTIC it's somewhere around +/- 10 or 12 degF on a daily basis during that period. In the DEAD of winter when it hardly gets near unfreezing -- it's EVEN HIGHER.
Why do you panic about temperature variance on a DAY TO DAY basis when you KNOW that the variance is VERY high?

Places that were above the sea and now are below are that way because of tectonic plate shifts. The natural temperature swings of the planet take thousands of years not a century.
Places that were above the sea and now are below are that way because of tectonic plate shifts. The natural temperature swings of the planet take thousands of years not a century.
Silly ass, I am hardly panicking on a daily projected variance. What I am doing is showing that every day, we are higher than the average in the past, and that, excepting a major volcanic eruption or impact, we will be warmer in the future than our average will be today.
Fearmongering daily because of natural variation and WEATHER..... Its only climate on a daily basis if its WARMING!Silly ass, I am hardly panicking on a daily projected variance. What I am doing is showing that every day, we are higher than the average in the past, and that, excepting a major volcanic eruption or impact, we will be warmer in the future than our average will be today.
No -- you and the undergrad students at the Re-Analyzer project who jack the keys to drive their "alternative weather truth machine" are BOTH are selecting SPECIAL DAYS to issue press releases and cause some susceptible people to shit their britches...
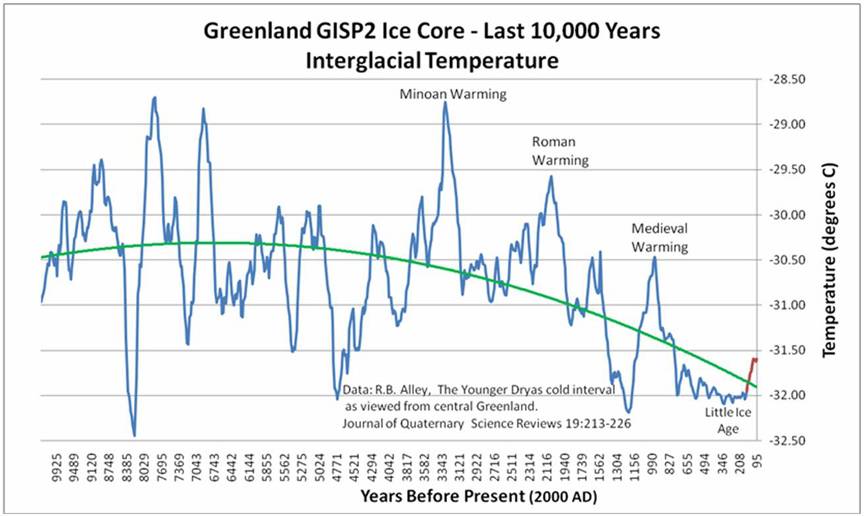
Interesting point; rate of rise is fare less than previously seen in our records and the rate of cooling can happen just as fast... yet they ignore the facts..Places that were above the sea and now are below are that way because of tectonic plate shifts. The natural temperature swings of the planet take thousands of years not a century.
Not according to these gold standard temperature reconstructions...
Places that were above the sea and now are below are that way because of tectonic plate shifts. The natural temperature swings of the planet take thousands of years not a century.
Not according to these gold standard temperature reconstructions...they show changes larger than anything we have seen and in a shorter period of time. In addition, they show pretty clearly that it is cooler now than it has been for most of the past 10,000 years.

I just read that this November the Arctic had the greatest increase in ice in recorded history
Fake news.Yes, yes, yes. NOAA admits that it got everything wrong. That the Arctic is in great shape and is quickly growing back to its frigid, icy old self.
NOT
Report Card
It was really a PERCENTAGE anomaly from record Low Levels of 2017.Yes, yes, yes. NOAA admits that it got everything wrong. That the Arctic is in great shape and is quickly growing back to its frigid, icy old self.
NOT
Report Card
It was really a PERCENTAGE anomaly from record Low Levels of 2017.Yes, yes, yes. NOAA admits that it got everything wrong. That the Arctic is in great shape and is quickly growing back to its frigid, icy old self.
NOT
Report Card
The latest version of:
Climate Deniers: Still 'Going Down the Up Escalator' | US Message ...
www.usmessageboard.com › US Discussion › Environment
Polar Science Center » PIOMAS Arctic Sea Ice Volume Reanalysis
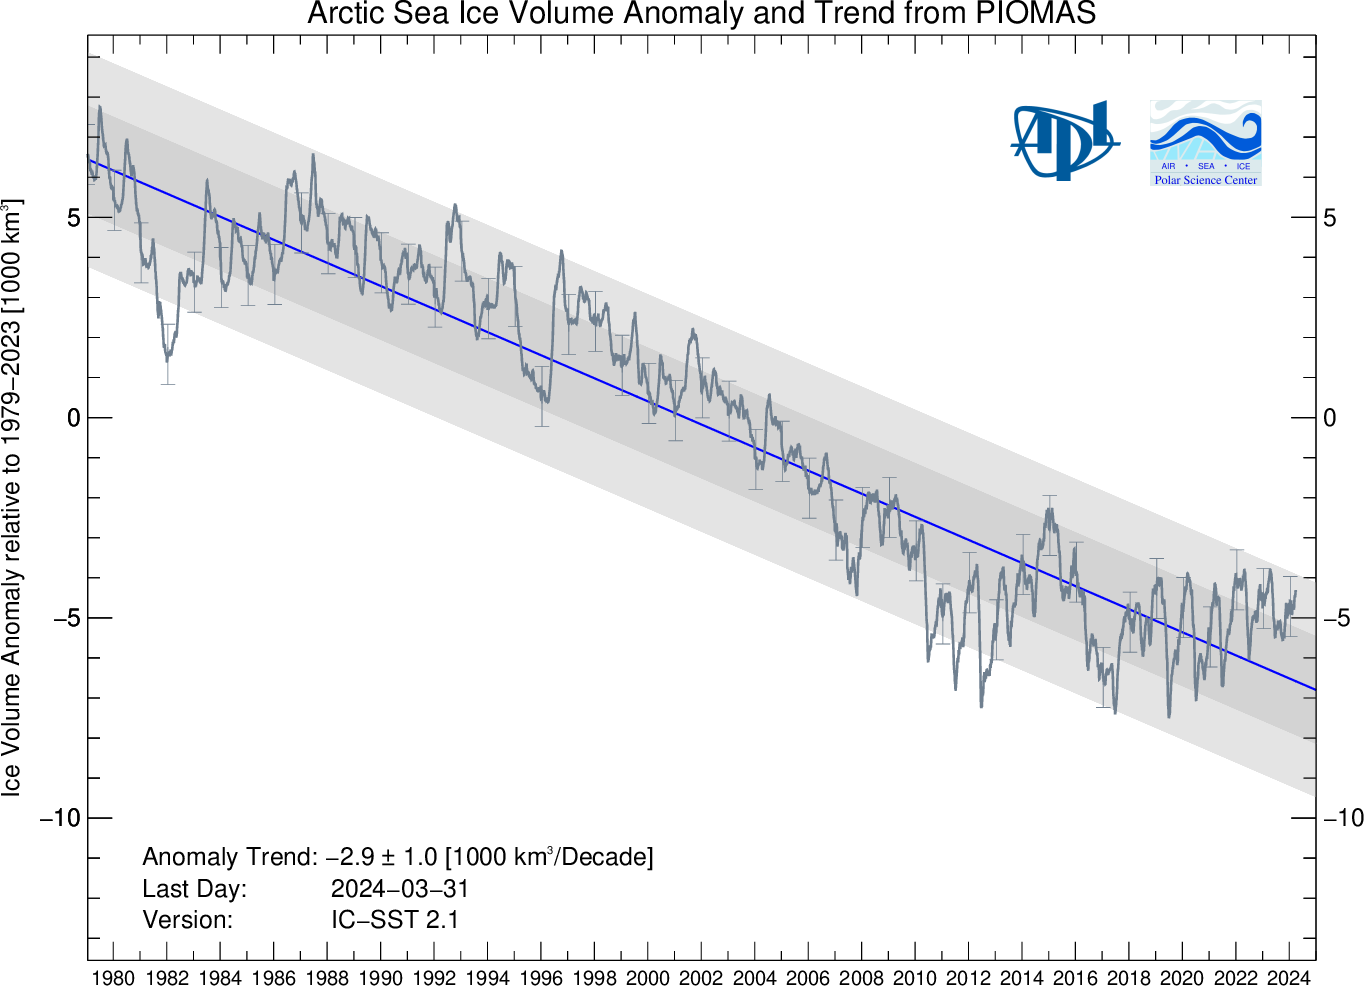
Arctic Sea Ice Volume Anomaly`
Sea Ice Volume is calculated using the Pan-Arctic Ice Ocean Modeling and Assimilation System (PIOMAS, Zhang and Rothrock, 2003) developed at APL/PSC. Anomalies for each day are calculated relative to the average over the 1979 -2016 period for that day of the year to remove the annual cycle. The model mean annual cycle of sea ice volume over this period ranges from 28,000 km3 in April to 11,500 km3 in September. The blue line represents the trend calculated from January 1 1979 to the most recent date indicated on the figure. Shaded areas represent one and two standard deviations of the residuals of the anomaly from the trend in Fig 1 and standard deviations about the daily 1979-2017 mean in Fig 2.
The year 2017 finished out with an annually averaged sea ice volume that was the Lowest on record with 12,900 km 3, below 2012 for which the annually averaged volume was 13,500 km3 . This was even though extent and sea ice thickness were at record lows during the early months of 2017 but anomalousy little melt for the recent years (Fig 8), brought the ice volume back above record levels.
Average Arctic sea ice volume in November 2018 was 9400 km3. This value is the 5th Lowest on record about 1200 km3 above the November record that was set in 2012 with ~8200 km3 and about 250 km3 lower higher 2017.
Ice volume was 53% below the maximum in 1979 and 36% Below the mean value for 1979-2017. November 2018 ice volume falls just a slightly above the long term trend line.
Relative rapid growth during November (Fig 8) leaves the ice thickness in the middle of the spectrum for recent years (Fig. 4). Ice thickness anomalies anomalies 2018 relative to 2011-2017 (Fig 6) show widespread Negative anomalies and with thicker than normal ice Only in the eastern Beaufort Sea. Thick ice in this area is to anomalous ice motion over the last 4 month that pushed sea ice against Banks Island and the western part of the Canadian Archipelago (Fig 7). This thickness anomaly pattern is supported by CryoSat thickness anomalies using the new version 2.1 from AWI. CryoSat thickness anomalies (Fig 9) are similar to PIOMAS but there are substantial differences in the Lincoln Sea and North of Fram Strait where CryoSat has positive anomalies. PIOMAS and CryoSat time series for November times series show little further decline in November sea ice volume since the exceptionally low values first seen in 2011 and 2012 (Figure 10).
[........]

 . So....what's that about the escalator?
It was really a PERCENTAGE anomaly from record Low Levels of 2017.Yes, yes, yes. NOAA admits that it got everything wrong. That the Arctic is in great shape and is quickly growing back to its frigid, icy old self.
NOT
Report Card
The latest version of:
Climate Deniers: Still 'Going Down the Up Escalator' | US Message ...
www.usmessageboard.com › US Discussion › Environment
Polar Science Center » PIOMAS Arctic Sea Ice Volume Reanalysis
Arctic Sea Ice Volume Anomaly`
Sea Ice Volume is calculated using the Pan-Arctic Ice Ocean Modeling and Assimilation System (PIOMAS, Zhang and Rothrock, 2003) developed at APL/PSC. Anomalies for each day are calculated relative to the average over the 1979 -2016 period for that day of the year to remove the annual cycle. The model mean annual cycle of sea ice volume over this period ranges from 28,000 km3 in April to 11,500 km3 in September. The blue line represents the trend calculated from January 1 1979 to the most recent date indicated on the figure. Shaded areas represent one and two standard deviations of the residuals of the anomaly from the trend in Fig 1 and standard deviations about the daily 1979-2017 mean in Fig 2.
The year 2017 finished out with an annually averaged sea ice volume that was the Lowest on record with 12,900 km 3, below 2012 for which the annually averaged volume was 13,500 km3 . This was even though extent and sea ice thickness were at record lows during the early months of 2017 but anomalousy little melt for the recent years (Fig 8), brought the ice volume back above record levels.
Average Arctic sea ice volume in November 2018 was 9400 km3. This value is the 5th Lowest on record about 1200 km3 above the November record that was set in 2012 with ~8200 km3 and about 250 km3 lower higher 2017.
Ice volume was 53% below the maximum in 1979 and 36% Below the mean value for 1979-2017. November 2018 ice volume falls just a slightly above the long term trend line.
Relative rapid growth during November (Fig 8) leaves the ice thickness in the middle of the spectrum for recent years (Fig. 4). Ice thickness anomalies anomalies 2018 relative to 2011-2017 (Fig 6) show widespread Negative anomalies and with thicker than normal ice Only in the eastern Beaufort Sea. Thick ice in this area is to anomalous ice motion over the last 4 month that pushed sea ice against Banks Island and the western part of the Canadian Archipelago (Fig 7). This thickness anomaly pattern is supported by CryoSat thickness anomalies using the new version 2.1 from AWI. CryoSat thickness anomalies (Fig 9) are similar to PIOMAS but there are substantial differences in the Lincoln Sea and North of Fram Strait where CryoSat has positive anomalies. PIOMAS and CryoSat time series for November times series show little further decline in November sea ice volume since the exceptionally low values first seen in 2011 and 2012 (Figure 10).
[........]
