3+ meters of sea level by 2100 possible

Global sea levels could rise by more than three metres – over half a metre more than previously thought – this century alone, according to a new study co-authored by a University of Southampton scientist.

An international team including Sybren Drijfhout, Professor in Physical Oceanography and Climate Physics, looked at what might happen if carbon dioxide emissions continue unabated.

Using new projections of Antarctic mass loss and a revised statistical method, they concluded that a worst-case scenario of a 2.5 to three-metre sea level rise was possible by 2100.

Professor Drijfhout said: "It might be an unlikely scenario, but we can't exclude the possibility of global sea levels rising by more than three metres by the year 2100.

"Unabated global warming will lead to sea-level rise of many metres – possibly more than ten metres – within a few centuries, seriously threatening many cities all over the world that are built in low-lying river deltas. This will also seriously affect the coastline of the UK."

The research – published this month in Environmental Research Letters – is consistent with the National Oceanic and Atmospheric Administration's (NOAA) recent adjustment of its possible future high-end sea-level rise from two to 2.5 metres.

However, the new study integrated different model estimates with a new statistical method, whereas the NOAA estimate relied on expert judgment.

Recent observation and modelling studies have shown the future melt of Antarctica might happen dramatically faster than previously thought.

Sea levels could rise by more than three metres, shows new study

Seems we started with maybe a 10 inch rise, and now we are looking at possibly over 10 feet of sea level rise. Guess we will find out, as the dingleberries are going to prevent anything being done to alleviate the rise in GHGs.
Well the 22nd Century is still a bit off.

I will be long gone by then.
 
Global sea levels could rise by more than three metres – over half a metre more than previously thought – this century alone, according to a new study co-authored by a University of Southampton scientist.

An international team including Sybren Drijfhout, Professor in Physical Oceanography and Climate Physics, looked at what might happen if carbon dioxide emissions continue unabated.

Using new projections of Antarctic mass loss and a revised statistical method, they concluded that a worst-case scenario of a 2.5 to three-metre sea level rise was possible by 2100.

Professor Drijfhout said: "It might be an unlikely scenario, but we can't exclude the possibility of global sea levels rising by more than three metres by the year 2100.

"Unabated global warming will lead to sea-level rise of many metres – possibly more than ten metres – within a few centuries, seriously threatening many cities all over the world that are built in low-lying river deltas. This will also seriously affect the coastline of the UK."

The research – published this month in Environmental Research Letters – is consistent with the National Oceanic and Atmospheric Administration's (NOAA) recent adjustment of its possible future high-end sea-level rise from two to 2.5 metres.

However, the new study integrated different model estimates with a new statistical method, whereas the NOAA estimate relied on expert judgment.

Recent observation and modelling studies have shown the future melt of Antarctica might happen dramatically faster than previously thought.

Sea levels could rise by more than three metres, shows new study

Seems we started with maybe a 10 inch rise, and now we are looking at possibly over 10 feet of sea level rise. Guess we will find out, as the dingleberries are going to prevent anything being done to alleviate the rise in GHGs.
So what? There are ancient cities underwater right now from sea levels rising. It happens. In fact there is no proof to show that the sea levels ever stopped rising since the end of the last ice age.
 
Global sea levels could rise by more than three metres – over half a metre more than previously thought – this century alone, according to a new study co-authored by a University of Southampton scientist.


An international team including Sybren Drijfhout, Professor in Physical Oceanography and Climate Physics, looked at what might happen if carbon dioxide emissions continue unabated.

Using new projections of Antarctic mass loss and a revised statistical method, they concluded that a worst-case scenario of a 2.5 to three-metre sea level rise was possible by 2100.

Professor Drijfhout said: "It might be an unlikely scenario, but we can't exclude the possibility of global sea levels rising by more than three metres by the year 2100.

"Unabated global warming will lead to sea-level rise of many metres – possibly more than ten metres – within a few centuries, seriously threatening many cities all over the world that are built in low-lying river deltas. This will also seriously affect the coastline of the UK."

The research – published this month in Environmental Research Letters – is consistent with the National Oceanic and Atmospheric Administration's (NOAA) recent adjustment of its possible future high-end sea-level rise from two to 2.5 metres.

However, the new study integrated different model estimates with a new statistical method, whereas the NOAA estimate relied on expert judgment.

Recent observation and modelling studies have shown the future melt of Antarctica might happen dramatically faster than previously thought.

Professor Drijfhout and scientists at the Royal Netherlands Meteorological Institute, which led the research, took this and other factors – including ocean warming, glacier melt, land water storage and Greenland ice sheet melt – into account to create their projection.

"This is the first time that robust statistical techniques have been used to develop a scenario like this, whereas previous high-end sea level projections have always been based on subjective expert judgment," said Professor Drijfhout.

"It's important for policy-makers and the general public to know what the consequences might be when carbon dioxide emissions are not decreased, especially as there is a severe time-lag between emission-reduction and the sea-level rise response.

"Also, the construction of artificial flood defences need to take account of low-probability events, including the possibility that the international community fails to take adequate measures in reducing measures.

"We should not forget that the Paris Agreement is only a declaration of intention, and that no adequate measures have yet been agreed to turn these intentions into policy."

The team's projection explicitly accounted for three scientific uncertainties – the speed at which the Antarctic ice sheet is going to melt, the speed at which the ocean is warming up, and the amount of emitted greenhouse gases over the 21st century.

Explore further: Regional sea-level scenarios will help Northeast plan for faster-than-global rise

More information: Dewi Le Bars et al. A high-end sea level rise probabilistic projection including rapid Antarctic ice sheet mass loss, Environmental Research Letters (2017). DOI: 10.1088/1748-9326/aa6512

Journal reference: Environmental Research Letters

Provided by: University of Southampton


Read more at: Sea levels could rise by more than three metres, shows new study

oh, a study shows it

I'm

convinced.

totally
 
Q. how much must we lower CO2 in order to stop the sea level rise?

A. $15 Trillion
 
Check out the rate of change,

Indeed. The recent rate of change had been steadily dropping for thousands of years, and was close to zero. Then, after the CO3 rose, the rate of change suddenly took off.

When you go in a direction exactly opposite the natural trend, that almost always indicates it's not natural. That's just what happened.

So why do you say it's natural? That makes no sense at all.
 
IOW, you're making the assumption that human civilization has anything to do with solar systemic wide changes in planetary weather changes. . . right?

There are no "solar systemic wide changes in planetary weather".

Which of your cult leaders told you there were, and why did you believe such a crazy story?

Solar output is dropping. Would you like to explain to us how that causes warming?
 
Global sea levels could rise by more than three metres – over half a metre more than previously thought – this century alone, according to a new study co-authored by a University of Southampton scientist.

An international team including Sybren Drijfhout, Professor in Physical Oceanography and Climate Physics, looked at what might happen if carbon dioxide emissions continue unabated.

Using new projections of Antarctic mass loss and a revised statistical method, they concluded that a worst-case scenario of a 2.5 to three-metre sea level rise was possible by 2100.

Professor Drijfhout said: "It might be an unlikely scenario, but we can't exclude the possibility of global sea levels rising by more than three metres by the year 2100.

"Unabated global warming will lead to sea-level rise of many metres – possibly more than ten metres – within a few centuries, seriously threatening many cities all over the world that are built in low-lying river deltas. This will also seriously affect the coastline of the UK."

The research – published this month in Environmental Research Letters – is consistent with the National Oceanic and Atmospheric Administration's (NOAA) recent adjustment of its possible future high-end sea-level rise from two to 2.5 metres.

However, the new study integrated different model estimates with a new statistical method, whereas the NOAA estimate relied on expert judgment.

Recent observation and modelling studies have shown the future melt of Antarctica might happen dramatically faster than previously thought.

Sea levels could rise by more than three metres, shows new study

Seems we started with maybe a 10 inch rise, and now we are looking at possibly over 10 feet of sea level rise. Guess we will find out, as the dingleberries are going to prevent anything being done to alleviate the rise in GHGs.
You are really scraping the bottom of the scum bucket now.
All the links that are in your post refer to a tweet that is being shared on facebook...204 times when I looked at it.
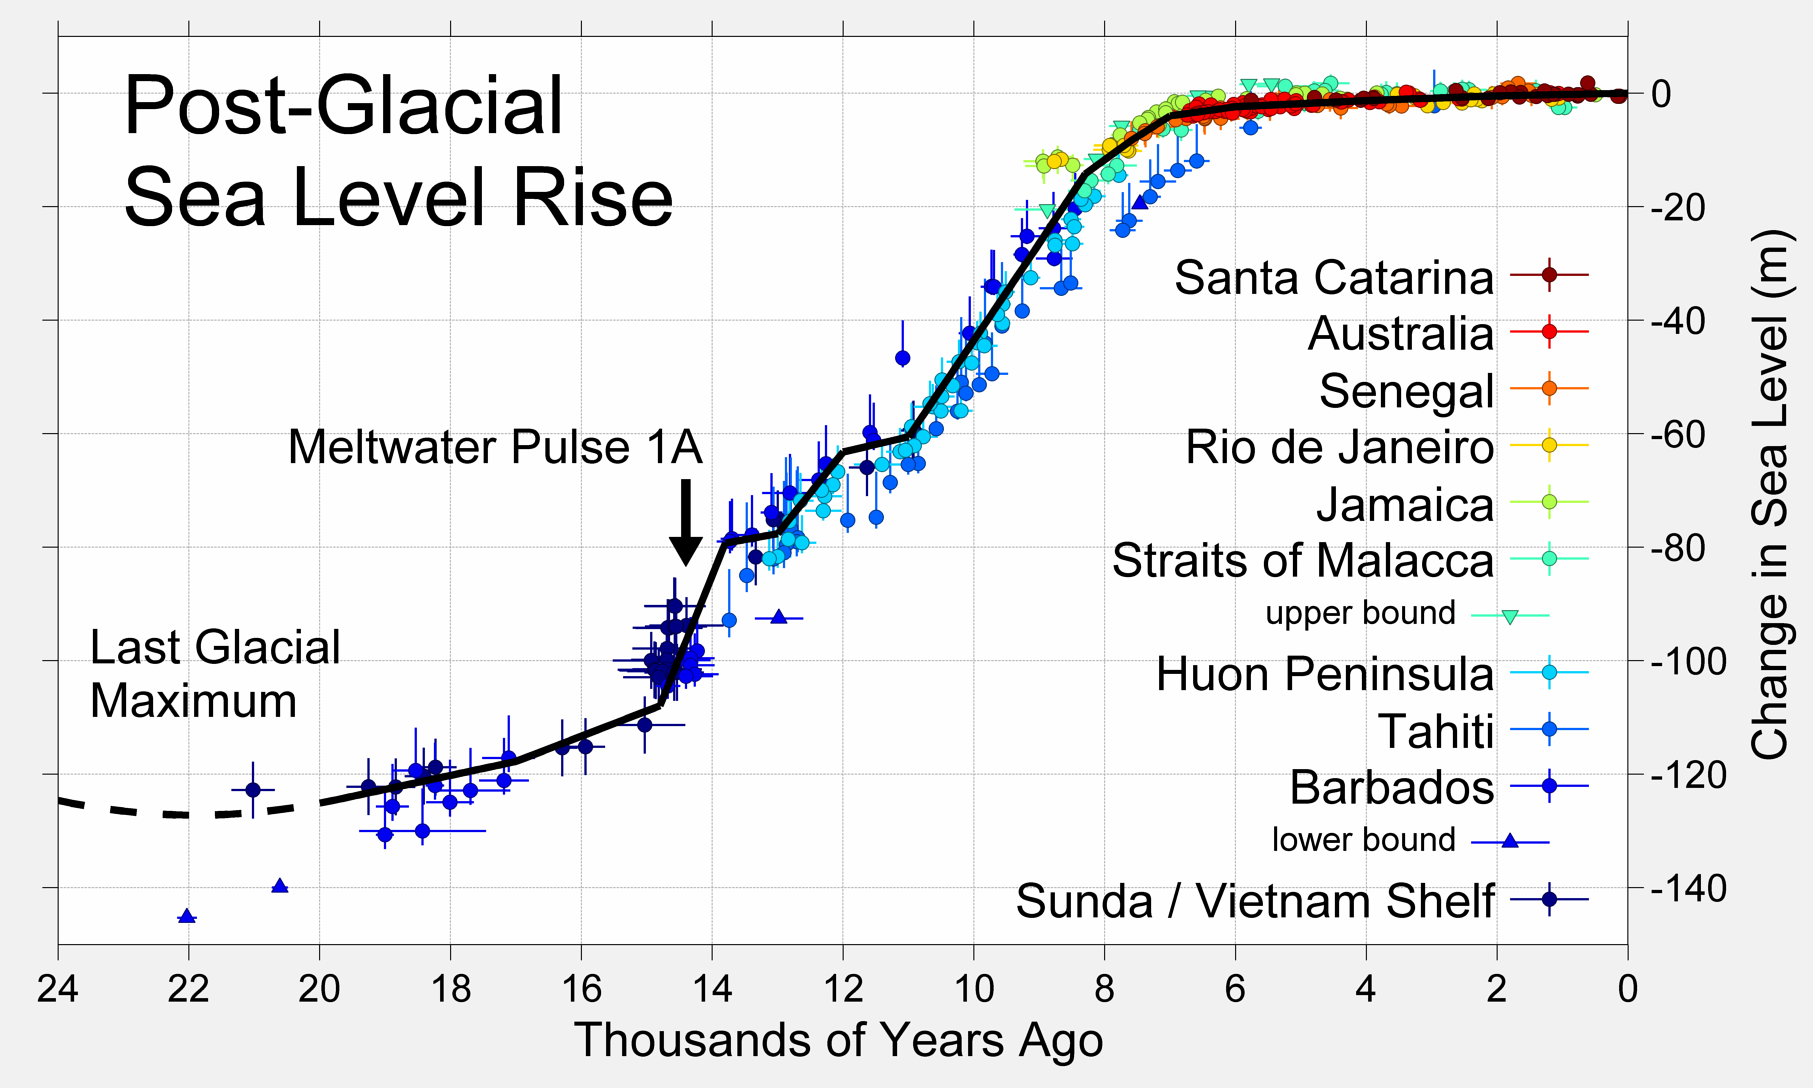
And the picture you posted without the link was from here:
Sea level rise - Wikipedia

Trends_in_global_average_absolute_sea_level%2C_1880-2013.png

Right next to this one on the same page:
Post-Glacial_Sea_Level.png

No wonder you posted it without the link.
Check out the rate of change, 50 meters in 2000 years 8000 years ago, long before we burnt fossil fuel...sea level went up 1 inch per year
And in the graph you posted it took 30 years (1980 to 2010) to come up by just 2 inches...( 0.066 inches per year)
Is sea level rising?

Global sea level has been rising over the past century, and the rate has increased in recent decades. In 2014, global sea level was 2.6 inchesabove the 1993 average—the highest annual average in the satellite record (1993-present). Sea level continues to rise at a rate of about one-eighth of an inch per year.

Higher sea levels mean that deadly and destructive storm surges push farther inland than they once did, which also means more frequent nuisance flooding. Disruptive and expensive, nuisance flooding is estimated to be from 300 percent to 900 percent more frequent within U.S. coastal communities than it was just 50 years ago.

The two major causes of global sea level rise are thermal expansion caused by warming of the ocean (since water expands as it warms) and increased melting of land-based ice, such as glaciers and ice sheets. The oceans are absorbing more than 90 percent of the increased atmospheric heat associated with emissions from human activity.

2.6 inches 1993 to 2014. And as Greenland continues to warm at a much higher rate than anyone expected, that will increase rapidly.


NASA's Earth Science News Team

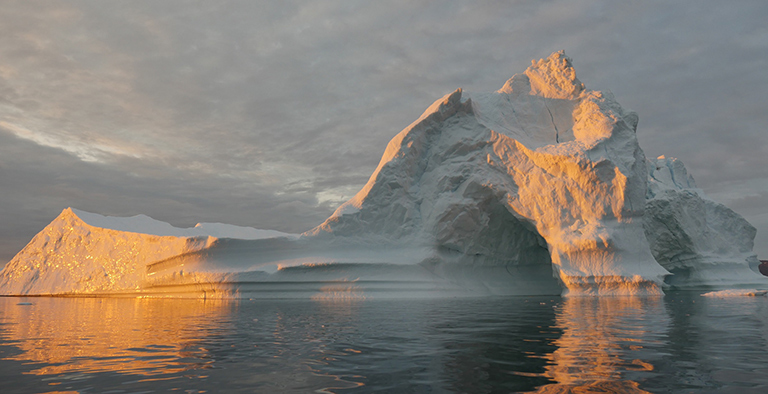
2328_warming-seas-featureMAIN-768px-97.jpg

An iceberg floats in Disko Bay, near Ilulissat, Greenland, on July 24, 2015. The massive Greenland ice sheet is shedding about 300 gigatons of ice a year into the ocean, making it the single largest source of sea level rise from melting ice. Credit: NASA/Saskia Madlener

Sea level rise is a natural consequence of the warming of our planet.

We know this from basic physics. When water heats up, it expands. So when the ocean warms, sea level rises. When ice is exposed to heat, it melts. And when ice on land melts and water runs into the ocean, sea level rises.


For thousands of years, sea level has remained relatively stable and human communities have settled along the planet's coastlines. But now Earth's seas are rising. Globally, sea level has risen about eight inches (20 centimeters) since the beginning of the 20th century and more than two inches (5 centimeters) in the last 20 years alone.


All signs suggest that this rise is accelerating.

While NASA and other agencies continue to monitor the warming of the ocean and changes to the planet's land masses, the biggest concern is what will happen to the ancient ice sheets covering Greenland and Antarctica, which continue to send out alerts that a warming planet is affecting their stability.

Climate Change: Vital Signs of the Planet: Warming seas and melting ice sheets

 
Global sea levels could rise by more than three metres – over half a metre more than previously thought – this century alone, according to a new study co-authored by a University of Southampton scientist.

An international team including Sybren Drijfhout, Professor in Physical Oceanography and Climate Physics, looked at what might happen if carbon dioxide emissions continue unabated.

Using new projections of Antarctic mass loss and a revised statistical method, they concluded that a worst-case scenario of a 2.5 to three-metre sea level rise was possible by 2100.

Professor Drijfhout said: "It might be an unlikely scenario, but we can't exclude the possibility of global sea levels rising by more than three metres by the year 2100.

"Unabated global warming will lead to sea-level rise of many metres – possibly more than ten metres – within a few centuries, seriously threatening many cities all over the world that are built in low-lying river deltas. This will also seriously affect the coastline of the UK."

The research – published this month in Environmental Research Letters – is consistent with the National Oceanic and Atmospheric Administration's (NOAA) recent adjustment of its possible future high-end sea-level rise from two to 2.5 metres.

However, the new study integrated different model estimates with a new statistical method, whereas the NOAA estimate relied on expert judgment.

Recent observation and modelling studies have shown the future melt of Antarctica might happen dramatically faster than previously thought.

Sea levels could rise by more than three metres, shows new study

Seems we started with maybe a 10 inch rise, and now we are looking at possibly over 10 feet of sea level rise. Guess we will find out, as the dingleberries are going to prevent anything being done to alleviate the rise in GHGs.

Bitchin' curl, Dude.

1920x1080_schultz_t_0160.jpg
 
One way we know about sea level history ... Roman fish holding tanks, and eclipses.

Fish tanks of eastern Crete (Greece) as indicators of the Roman sea level
---
Highlights
► Submerged Roman fish tanks of Matala, Chersonissos, Mochlos, Sitia, Zakros in Crete. ► Use of roman fish tanks as tools for the dating of ancient sea levels. ► The submersion event is connected with the strong earthquake of 1604. ► Determination of a 1st and 2nd c. AD sea level 1.24 m ± 0.09 m lower than the present. ► Average rate of change in the land–sea relationship for 1900 ± 100 yrs BP is 0.65 mm/yr.
---

The Romans built stone holding tanks on their shorelines to hold live fish.for people to buy. The tanks had a standard design, with the top edge about 20cm above the highest high tide level. By seeing how far below the surface they are now, we know how much sea level has risen since Roman Times.

And then there are eclipses. Ancient astronomers were really damn good. They had water clocks good to around a minute a day, and they very carefully recorded the times when eclipses happened. We can calculate now when those eclipses should have happened. But there's one variable, the rotation speed of earth. The earth constantly slows a little, but also, when sea level rises, mass moves from poles to equator, so the earth slows more.

So, by looking at times of eclipses down the ages, and running the calcs, we can see when the sea level rise happened. And, as it turns out, most of it is recent.
 
Global sea levels could rise by more than three metres – over half a metre more than previously thought – this century alone, according to a new study co-authored by a University of Southampton scientist.

An international team including Sybren Drijfhout, Professor in Physical Oceanography and Climate Physics, looked at what might happen if carbon dioxide emissions continue unabated.

Using new projections of Antarctic mass loss and a revised statistical method, they concluded that a worst-case scenario of a 2.5 to three-metre sea level rise was possible by 2100.

Professor Drijfhout said: "It might be an unlikely scenario, but we can't exclude the possibility of global sea levels rising by more than three metres by the year 2100.

"Unabated global warming will lead to sea-level rise of many metres – possibly more than ten metres – within a few centuries, seriously threatening many cities all over the world that are built in low-lying river deltas. This will also seriously affect the coastline of the UK."

The research – published this month in Environmental Research Letters – is consistent with the National Oceanic and Atmospheric Administration's (NOAA) recent adjustment of its possible future high-end sea-level rise from two to 2.5 metres.

However, the new study integrated different model estimates with a new statistical method, whereas the NOAA estimate relied on expert judgment.

Recent observation and modelling studies have shown the future melt of Antarctica might happen dramatically faster than previously thought.

Sea levels could rise by more than three metres, shows new study

Seems we started with maybe a 10 inch rise, and now we are looking at possibly over 10 feet of sea level rise. Guess we will find out, as the dingleberries are going to prevent anything being done to alleviate the rise in GHGs.

Just last week Mamooth and other warmers were bugging me about the MEDIA and the POLITICOS always ending up with the "Worst Case Numbers".. In fact Mamooth questioned my judgement and memory on how this got the whole GW gravy train on track.

Well HERE is your "worst case scenario" getting headlines. Wasn't good enough to use NOAA's "judgement" these guys employed several models. Which is quicker way to make up scenarios that will largely never come to pass and frighten the public with them..

Even the lead author is a bit sheepish and looking for cover from the hype....

Professor Drijfhout said: "It might be an unlikely scenario, but we can't exclude the possibility of global sea levels rising by more than three metres by the year 2100.

Read more at: Sea levels could rise by more than three metres, shows new study

So --- who wants to bet -- I go fetch the RANGE of projections and find that the MEDIAN for 2100 is less than a meter???? And that the RANGE is higher than the last IPCC guesstimate?
 
Global sea levels could rise by more than three metres – over half a metre more than previously thought – this century alone, according to a new study co-authored by a University of Southampton scientist.

An international team including Sybren Drijfhout, Professor in Physical Oceanography and Climate Physics, looked at what might happen if carbon dioxide emissions continue unabated.

Using new projections of Antarctic mass loss and a revised statistical method, they concluded that a worst-case scenario of a 2.5 to three-metre sea level rise was possible by 2100.

Professor Drijfhout said: "It might be an unlikely scenario, but we can't exclude the possibility of global sea levels rising by more than three metres by the year 2100.

"Unabated global warming will lead to sea-level rise of many metres – possibly more than ten metres – within a few centuries, seriously threatening many cities all over the world that are built in low-lying river deltas. This will also seriously affect the coastline of the UK."

The research – published this month in Environmental Research Letters – is consistent with the National Oceanic and Atmospheric Administration's (NOAA) recent adjustment of its possible future high-end sea-level rise from two to 2.5 metres.

However, the new study integrated different model estimates with a new statistical method, whereas the NOAA estimate relied on expert judgment.

Recent observation and modelling studies have shown the future melt of Antarctica might happen dramatically faster than previously thought.

Sea levels could rise by more than three metres, shows new study

Seems we started with maybe a 10 inch rise, and now we are looking at possibly over 10 feet of sea level rise. Guess we will find out, as the dingleberries are going to prevent anything being done to alleviate the rise in GHGs.


Al Gore said this would happen by 2015 about a decade ago. Nobody really knows...to say otherwise is horseshit.
 
Well yeah. Fear and hype. It's what you expect to bounce around the blogosphere and the media when it comes to "GW Studies". I was correct. In the paper (referenced below) these guys set out to FIND estimates for ONLY the high end of the probable scenarios that they possibly could. This study didn't even concern itself at ALL with the REASONABLE, rational LIKELY scenarios -- only the "disastrous tails" of the Prob Density Function distribution.

And as SUCH -- no mention of the plan or the thesis or the methods used is given to the public in all the press releases. If you think a PDF is an Adobe document --- give it up right here -- you'll never understand the nuance of what these guys set out to find. But I'll tell you -- the PROBABILITY of a sea level rise GREATER then 2.5Meter is below about 3%. And NONE of this really alters the general estimates from AR5 of about 1.0Meter as a WORST CASE...

erlaa6512f1_online.jpg


Red is AR5 estimate based on ALL factors. The others are the new "disaster zone" estimates based on only guesses at the most EXTREME scenarios.

A high-end sea level rise probabilistic projection including rapid Antarctic ice sheet mass loss - IOPscience

Unfortunately there remains considerable uncertainty. The Antarctic ice sheet is potentially the largest contributor to future sea level rise but also the most uncertain (Meehl et al 2007, Church et al 2013, Levermann et al 2014, Ritz et al 2015, Deconto and Pollard 2016). In 2013 the fifth assessment report (AR5) from the Intergovernmental Panel on Climate Change (IPCC) assessed the likelihood for an extensive grounding line retreat of the Antarctic ice sheet, that would contribute significantly to sea level rise, to less than 34% (Church et al 2013). In such a case, there was a medium confidence that the magnitude would be 'several tenths of a meter'. However, for long term projects that have a high risk aversion, low probability events also need to be taken into account (Veerman 2008, Ranger et al 2013, Hinkel et al 2015). This can be done in different ways: convening an expert committee to develop extreme scenarios (Katsman et al 2011, Ranger et al 2013), conducting a large expert assessment survey (Horton et al 2014) or combining expert assessment of ice sheet contribution (Bamber and Aspinall 2013, de Vries and van de Wal 2015) with climate models projections (Jevrejeva et al 2014, Grinsted et al 2015). It is difficult with these approaches to capture the correlation between ice sheet mass loss and all the other processes. Also important subjective choices are involved in each of these methods (de Vries and van de Wal 2015). Until recently such choices were unavoidable as climate projections with an ice sheet model were either not available at all, or carried out by models that did not include processes that become important when identifying the high end of the distribution.

For the RCP8.5 scenario, the PDF obtained has a median of 184 cm and a 95% quantile of 292 cm. The large shift of the median is entirely caused by replacing the AR5 median values by new high-end Antarctic estimate but a considerable part of change of the higher quantiles comes from the other two extensions. The method described here provides a systematic way to build a probabilistic projection of extreme sea level.

By just focusing on the small probability high-end sea level rise it seems reasonable to assume a normal distribution as in Deconto and Pollard (2016).

There it ain't.. Complete focus on the far out LOW PROBABILITY doom scenarios... You've been punked and scared again.. And WORSE -- the CMIP models SUCK at estimates for the Antarctic. So adding temperature modeling into the mix just makes the disaster scenarios wider and more scary...
 
Last edited:
So --- who wants to bet -- I go fetch the RANGE of projections and find that the MEDIAN for 2100 is less than a meter???? And that the RANGE is higher than the last IPCC guesstimate?

A high-end sea level rise probabilistic projection including rapid Antarctic ice sheet mass loss - IOPscience

erlaa6512f1


Red is the IPCC estimate. Green is the paper estimate. It's around 1.8m. You lost your bet on the median big time. You won it on the range.

You didn't READ the paper, it's goal or the METHODS used. So your ass aint got no clue what you're looking at.. See above...
 
One way we know about sea level history ... Roman fish holding tanks, and eclipses.

Fish tanks of eastern Crete (Greece) as indicators of the Roman sea level
---
Highlights
► Submerged Roman fish tanks of Matala, Chersonissos, Mochlos, Sitia, Zakros in Crete. ► Use of roman fish tanks as tools for the dating of ancient sea levels. ► The submersion event is connected with the strong earthquake of 1604. ► Determination of a 1st and 2nd c. AD sea level 1.24 m ± 0.09 m lower than the present. ► Average rate of change in the land–sea relationship for 1900 ± 100 yrs BP is 0.65 mm/yr.
---

The Romans built stone holding tanks on their shorelines to hold live fish.for people to buy. The tanks had a standard design, with the top edge about 20cm above the highest high tide level. By seeing how far below the surface they are now, we know how much sea level has risen since Roman Times.

And then there are eclipses. Ancient astronomers were really damn good. They had water clocks good to around a minute a day, and they very carefully recorded the times when eclipses happened. We can calculate now when those eclipses should have happened. But there's one variable, the rotation speed of earth. The earth constantly slows a little, but also, when sea level rises, mass moves from poles to equator, so the earth slows more.

So, by looking at times of eclipses down the ages, and running the calcs, we can see when the sea level rise happened. And, as it turns out, most of it is recent.

Did you adjust for Obama lowering the sea levels?
 
Well yeah. Fear and hype. It's what you expect to bounce around the blogosphere and the media when it comes to "GW Studies". I was correct. In the paper (referenced below) these guys set out to FIND estimates for ONLY the high end of the probable scenarios that they possibly could. This study didn't even concern itself at ALL with the REASONABLE, rational LIKELY scenarios -- only the "disastrous tails" of the Prob Density Function distribution.

And as SUCH -- no mention of the plan or the thesis or the methods used is given to the public in all the press releases. If you think a PDF is an Adobe document --- give it up right here -- you'll never understand the nuance of what these guys set out to find. But I'll tell you -- the PROBABILITY of a sea level rise GREATER then 2.5Meter is below about 3%. And NONE of this really alters the general estimates from AR5 of about 1.0Meter as a WORST CASE...

erlaa6512f1_online.jpg


Red is AR5 estimate based on ALL factors. The others are the new "disaster zone" estimates based on only guesses at the most EXTREME scenarios.

A high-end sea level rise probabilistic projection including rapid Antarctic ice sheet mass loss - IOPscience

Unfortunately there remains considerable uncertainty. The Antarctic ice sheet is potentially the largest contributor to future sea level rise but also the most uncertain (Meehl et al 2007, Church et al 2013, Levermann et al 2014, Ritz et al 2015, Deconto and Pollard 2016). In 2013 the fifth assessment report (AR5) from the Intergovernmental Panel on Climate Change (IPCC) assessed the likelihood for an extensive grounding line retreat of the Antarctic ice sheet, that would contribute significantly to sea level rise, to less than 34% (Church et al 2013). In such a case, there was a medium confidence that the magnitude would be 'several tenths of a meter'. However, for long term projects that have a high risk aversion, low probability events also need to be taken into account (Veerman 2008, Ranger et al 2013, Hinkel et al 2015). This can be done in different ways: convening an expert committee to develop extreme scenarios (Katsman et al 2011, Ranger et al 2013), conducting a large expert assessment survey (Horton et al 2014) or combining expert assessment of ice sheet contribution (Bamber and Aspinall 2013, de Vries and van de Wal 2015) with climate models projections (Jevrejeva et al 2014, Grinsted et al 2015). It is difficult with these approaches to capture the correlation between ice sheet mass loss and all the other processes. Also important subjective choices are involved in each of these methods (de Vries and van de Wal 2015). Until recently such choices were unavoidable as climate projections with an ice sheet model were either not available at all, or carried out by models that did not include processes that become important when identifying the high end of the distribution.

For the RCP8.5 scenario, the PDF obtained has a median of 184 cm and a 95% quantile of 292 cm. The large shift of the median is entirely caused by replacing the AR5 median values by new high-end Antarctic estimate but a considerable part of change of the higher quantiles comes from the other two extensions. The method described here provides a systematic way to build a probabilistic projection of extreme sea level.

By just focusing on the small probability high-end sea level rise it seems reasonable to assume a normal distribution as in Deconto and Pollard (2016).

There is ain't.. Complete focus on the far out LOW PROBABILITY doom scenarios... You've been punked and scared again.. And WORSE -- the CMIP models SUCK at estimates for the Antarctic. So adding temperature modeling into the mix just makes the disaster scenarios wider and more scary...


I have a post grad degree with a research emphasis. Here's what I know regarding global warming. Please correct me if I'm wrong.


1. The globe seems to be warming. It is roughly 1.5 degrees since 1960. The climate models have generally grossly over-estimated the actual warming that has taken place.

2. The warming is not uniform. Parts of the Arctic have risen as much as 15 degrees over the last 50 years. There are large parts of the Southern Hemisphere that have cooled as much as 5 degrees. No one really understands why.

3. There seems to a significant pause in global temperature rise since 2000 that directly contradictions almost every climate model. There is no adequate explanation yet for why this 15 pause has taken place.

4. Man produced CO2 seems to be a factor in the limited global warming that has taken place. But weather is influenced by hundreds of different variables. No one can clearly state how much of a factor man-made CO2 really is.


There are obviously many other facts, but those are the key ones I can identify.
 
BTW -- if anybody knows the diff between an Adobe PDF and a statistical PDF -- there's a big question on the methodology here. And that is -- if you set off to explore just the TAILS of distribution that everyone else has assumed to be completely random and "normal" -- the LAST type of statistical fit you would use for its PDF would be another "normal" curve. There are MANY more reasonable assumptions that could be made for a "low probability tail" of a process. Including Rayleigh distributions which are used to model systems with KNOWN peaks of probability at lower values and longer tails as you get more "extreme". Like wind speeds for instance. Or some noise probabilities in receiver designs.

The differences in their findings would be dramatic just making this alternate HARDER assumption.. Which by DEFINITION would be a better assumption..
 

Forum List

Back
Top