Where Does The Glacial Tipping Point Reside?

I know this doesn't seem to bother any of your denier cohorts, but I'd like to see a decent reference for your claim that Southern Hemisphere ice cover has reached unprecedented levels. I kinda figure you might be talking about all the way back to the beginning of satellite data in 1979. And I'm wondering how you extrapolate that to being sufficient to bring on a glaciation which hasn't taken place now in 22,000 years.

I bet when you speak at work, you get a lot of stunned looks. It's just I don't think the cause is what you think it is.
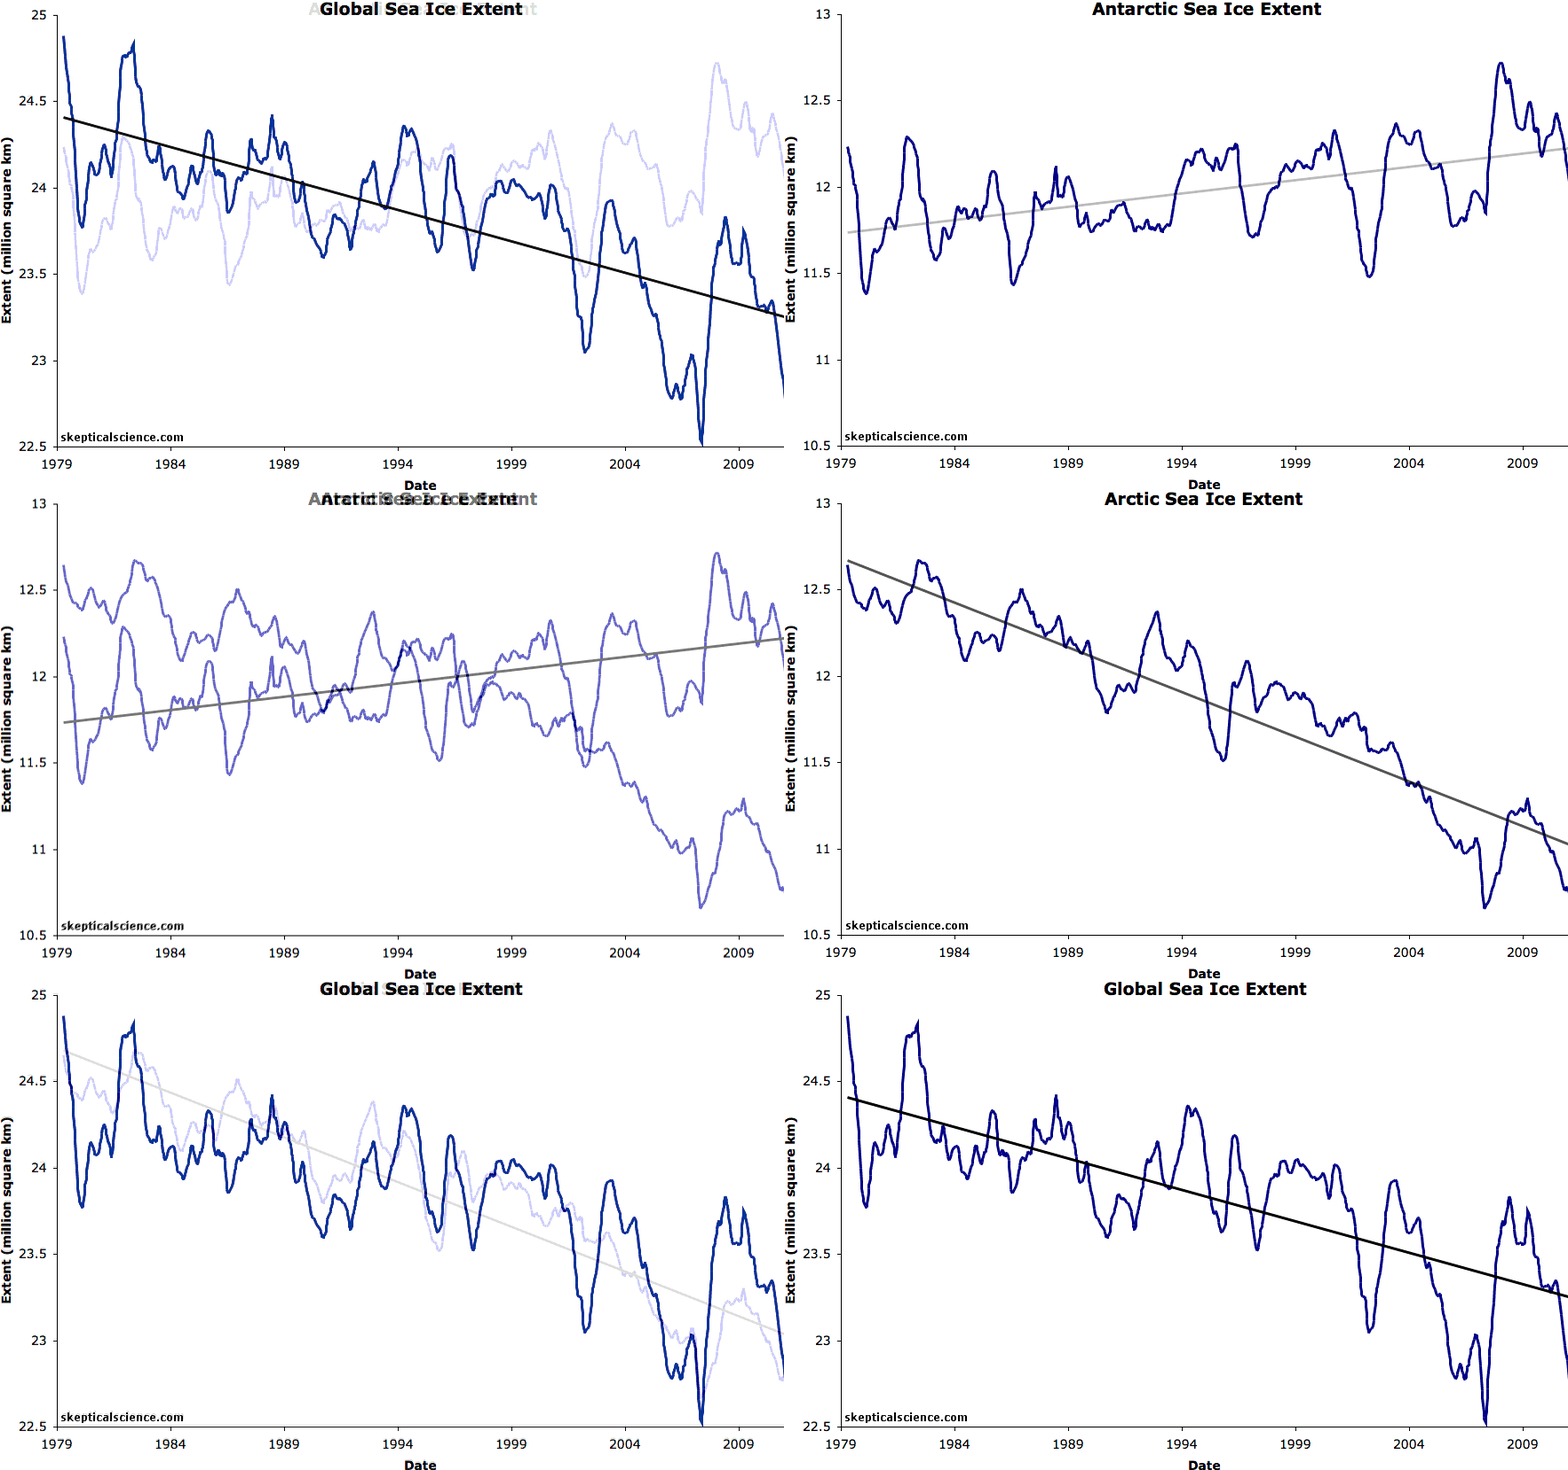
GlobalSeaIce.gif


[Below] A little dated but I don't see a trend that would produce what you're talking about
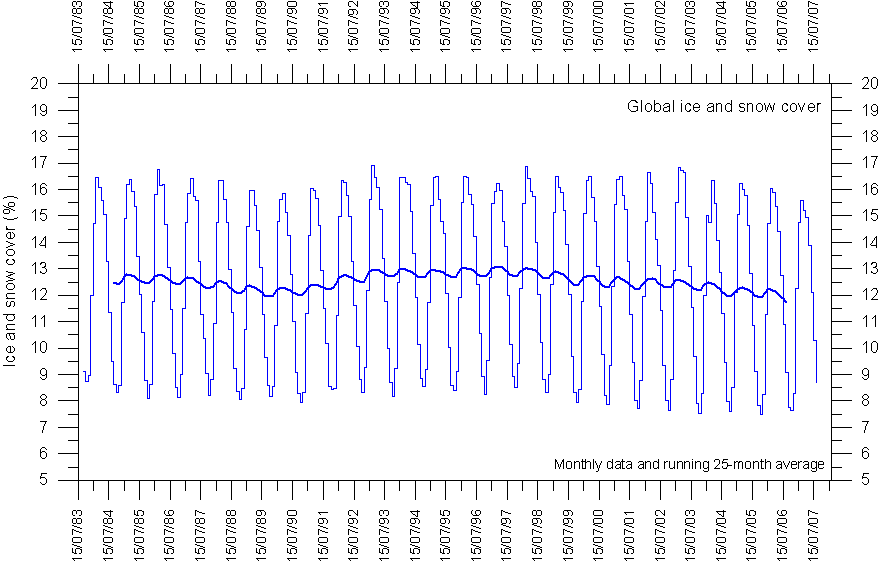
GlobalSnowAndIceCoverObservationsSince1983.gif

Nice graphs from 2009 and 2007....

Hate to be all science-like, but it is 2014.

That is by design as it conveniently removes the trend shift over the last 3-4 years.. Not unexpected however..
 
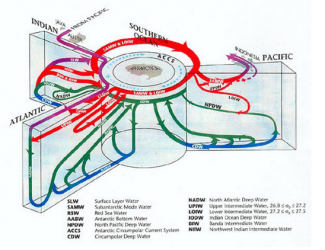
Why are circumpolar waters are so important to the southern hemisphere and earths over all climate? To answer this one must look at what is involved.

Corriente-Circumpolar-del-Ant%C3%A1rtico.jpg


Any blockage or slowing of the red arrows slows the major oceans heat transfer mechanism. A slow down near the horn of south america (choke point) would force massive amounts of cold water towards the equator while stagnating major areas of water around the pole. This shift would send other cycles into disarray and change many circulation patterns globally.

Once the oceans are essentially isolated from each other glaciation will progress rapidly. At current rate of ice growth we are about 6-10 years from this potential, If the earth continues to cool. The last time ice covered the ocean to the horn of South America it caused the drop of 10 deg C at the start of the Younger-Dryas event in just 40 years. The temperatures prior to that initial drop were comparable to today's temps.

Easterbrook-Natural_global_warming.jpg


“Numerous, abrupt, short-lived warming and cooling episodes much more intense than recent warming/cooling occurred during the late Pleistocene, none of which could have been caused by changes in atmospheric CO2,” said Easterbrook.

There are many who think just as I do that we are indeed headed for colder times...

Source of lower graph/article
 
Last edited:
"Many" meaning "a handful of fruit loops with no data to back them up".

Good luck with that.

Go on, name some of these "many". There's that one old guy in Russia that gets cited over and over... and ... and ... dang. There's got to be someone else, right?
 
Today's Update:

Oh how the fun is just beginning. We plotted 34 of the poorly sited city stations and we found a stunning thing. When we compared them to the closest CRN station over the last 12 years the linear trend was not significantly affected unless there was an instrumentation change.

SO prior to adjustments even the poorly sited stations are cooling and the linear trends are indistinguishable. But when we compare them to the HSS Adjusted Record the linear trend diverges showing rapid warming. 1 to 3 deg F.

There are some shaken individuals taking a hard look at what they believe tonight..
 
What are you babbling about? You toss out unsourced random information, much of it apparently cribbed from some serious whackaloons, and then you act like it means something.
 
What are you babbling about? You toss out unsourced random information, much of it apparently cribbed from some serious whackaloons, and then you act like it means something.

IF (and i use that term loosely) you had even a slight understanding of science you would understand what has been posted. Instead of asking questions you call names and show your ignorance...

As for unsourced? What are you talking about? they are clearly identified to those doing the research. You have no need to know that... (SEE! I can do the same thing you alarmist do)

When the plots are correlated and finished i will be more than happy to detail which stations of HSS are used. All data is publicly and currently available from the NOAA website.
 
What a fun Week.

We have all 242 well sited stations plotted along with all 114 CRN stations. The medium to poorly sited ones will be done next week and done to show station bias over time. Then the work on individual stations and changes begins.

Word spreads fast. We now have two other PHD's from one of our government organizations looking over our work as well. Evidently bad news for AGW travels fast. It seems we are throwing wrench in their adjustment algorithm by showing well sited stations they adjusted upward to match poorly sited stations were correct when they aligned with CRN data. The adjustments are therefore incorrectly applied. This has caused a minor stir... Many questions they asked were precisely about what it was I was setting out to prove. They were not amused when I stated that I was getting to the truth about our climate.

We haven't even begun to correlate CO2 levels, water vapor and other variables across the US to the graphing yet. What we have done so far is get the attention of some very influential people. Not sure if this is a bad thing or a good thing at this point.

Does anyone know the real, ground level average for CO2 in the US? You wont believe me if I told you. Lets see if any one really knows.
 
There's damn few people here - and everywhere else in your life - that aren't aware you live in a complete fantasy.
 
Today's Update:

Oh how the fun is just beginning. We plotted 34 of the poorly sited city stations and we found a stunning thing. When we compared them to the closest CRN station over the last 12 years the linear trend was not significantly affected unless there was an instrumentation change.

SO prior to adjustments even the poorly sited stations are cooling and the linear trends are indistinguishable. But when we compare them to the HSS Adjusted Record the linear trend diverges showing rapid warming. 1 to 3 deg F.

There are some shaken individuals taking a hard look at what they believe tonight..
Hey, dumb fuck, Link! OK, you just pulled it out of your ass, and nobody wants to go there.

Wow... the data is publicly available here.

Now go do your own work. I fully intend to submit my work for publication. Its up to me whether or not to give out spinets of it. until then I have described what it is we are doing..
 
Ooh, another pretend scientist pretending he's going to publish!

Sadly for you, originality is a requirement to get published. Not even the most desperate denier vanity journal will publish rehashed WUWT nonsense.

Of course, if you add in your "magnetism and gravity are the same thing" theory, that would make it quite original. Give it a try.
 
Climatesense-norpag
Here is the summary of the latest updated forecasts and observations as of end July 2014.

1/22/13 NH Forecast

1) The millennial peak is sharp – perhaps 18 years +/-. We have now had 16 years since 1997 with no net warming – and so might expect a sharp drop in a year or two – 2014/16 – with a net cooling by 2035 of about 0.35.Within that time frame however there could well be some exceptional years with NH temperatures +/- 0.25 degrees colder than that.

2) The cooling gradient might be fairly steep down to the Oort minimum equivalent which would occur about 2100. (about 1100 on Fig 5) ( Fig 3 here) with a total cooling in 2100 from the present estimated at about 1.2 +/-.

3) From 2100 on through the Wolf and Sporer minima equivalents with intervening highs to the Maunder Minimum equivalent which could occur from about 2600 – 2700 a further net cooling of about 0.7 degrees could occur for a total drop of 1.9 +/- degrees.

4) The time frame for the significant cooling in 2014 – 2016 is strengthened by recent developments already seen in solar activity. With a time lag of about 12 years between the solar driver proxy and climate we should see the effects of the sharp drop in the Ap Index which took place in 2004/5 in 2016-17.
4/02/13Global Forecast
1 Significant temperature drop at about 2016-17
2 Possible unusual cold snap 2021-22
3 Built in cooling trend until at least 2024
4 Temperature Hadsst3 moving average anomaly 2035 – 0.15
5 Temperature Hadsst3 moving average anomaly 2100 – 0.5
6 General Conclusion – by 2100 all the 20th century temperature rise will have been reversed,
7 By 2650 earth could possibly be back to the depths of another little ice age.
8 The effect of increasing CO2 emissions will be minor but beneficial – they may slightly ameliorate the forecast cooling and help maintain crop yields .
9 Warning !! There are some signs in the Livingston and Penn Solar data that a sudden drop to the Maunder Minimum Little Ice Age temperatures could be imminent – with a much more rapid and economically disruptive cooling than that forecast above which may turn out to be a best case scenario.”

3.2 2014 Updates and Observations..

3.2.1 Updates
a) NH Forecast- item 4. With regard to timing, closer examination of the Ap Index (Fig13) and Neutron Count (Fig.14) would suggest that the sharpest drop in activity is better placed at 2005/6 with the associated sharp temperature drop now forecast at 2017-18.
b) Global Forecast – item1. Significant temperature drop now forecast for 2017-18.
c) Global Forecast – item 9. Another year of flat Livingston and Penn umbral data suggests that a swift decline into a Maunder Minimum is now very unlikely.
3.2.2. Observations.
a) Solar Cycle 24 peak.
During the last year, Solar cycle 24 developed a second and higher Sunspot peak in February 2014 and activity has declined sharply since then. This decline should be reflected in a rapid increase in the Neutron Count in another 4 or 5 months, and the possible beginning of a more pronounced cooling phase. The sharp decline in solar activity since February may also lead to the non-appearance of the much anticipated El Nino.
b) The Polar Vortex Excursions.
I will quote again from the 2010 forecast:
“There will be a steeper temperature gradient from the tropics to the poles so that violent thunderstorms with associated flooding and tornadoes will be more frequent in the USA. At the same time the jet stream will swing more sharply North – South thus local weather in the Northern hemisphere in particular will be generally more variable with occasional more northerly heat waves and more southerly unusually cold snaps”

This forecast was spectacularly confirmed by the early 2014 excursions of the Polar Vortex into the United States. Indeed, as I write this in Houston on July 29, 2014 another unusually early Canadian front has just gone through Houston with heavy rains and thunderstorms. This is a harbinger of weather patterns which will become more frequent on a cooling planet. As the excursions occur later in the spring and begin earlier in the fall, the snow cover finally never melts over the NE of the American continent and after a few thousand years full ice age conditions will develop, as suggested by Steve Goddard:

Confirmation by empirical observed evidence. No modeling involved..
 
Ooh, another pretend scientist pretending he's going to publish!

Sadly for you, originality is a requirement to get published. Not even the most desperate denier vanity journal will publish rehashed WUWT nonsense.

Of course, if you add in your "magnetism and gravity are the same thing" theory, that would make it quite original. Give it a try.

Due tell, what mechanisms do BOTH EMPLOY? Here's a clue, they are both relative to mass, composition, and weight.

Wow magnetism = gravity? And gravity is "relative to mass, composition and weight"?

Ever hear of Newton's Law of Universal Gravitation? It goes like this:

F=G[(m1*m2)/r^2].

The force of gravity between two masses (say, you and the Earth) is equal to the Gravitational Constant ( 6.673×10⁻¹¹ N·(m/kg)2) times the ratio of the products of the two masses and the square of the center-to-center distance.

Do you see anything in there about composition? Do you see anything in there about weight (and, btw, since weight is produced by gravity and mass, you've got a bit of a circle jerk going there)? Do you see anything in there about magnetism? Do you understand what produces magnetism? Apparently not, oh fan of the "Real Science".

PS: It's not "Due tell", it's "Do tell", as in "Do tell us something or other"
 
And for the other side of your bizarro-world-ness:

Magnetism is a class of physical phenomena that are mediated by magnetic fields. Electric currents and the fundamental magnetic moments of elementary particles give rise to a magnetic field, which acts on other currents and magnetic moments. All materials are influenced to some extent by a magnetic field. The most familiar effect is on permanent magnets, which have persistent magnetic moments caused by ferromagnetism. Most materials do not have permanent moments. Some are attracted to a magnetic field (paramagnetism); others are repulsed by a magnetic field (diamagnetism); others have a much more complex relationship with an applied magnetic field (spin glass behavior and antiferromagnetism). Substances that are negligibly affected by magnetic fields are known as non-magnetic substances. They include copper, aluminium, gases, and plastic. Pure oxygen exhibits magnetic properties when cooled to aliquid state.

The magnetic state (or phase) of a material depends on temperature (and other variables such as pressure and the applied magnetic field) so that a material may exhibit more than one form of magnetism depending on its temperature, etc.
*************************************************************************************

This is from Wikipedia and is the intro to their article on magnetic materials. They have separate articles for electromagnetism and for magnetic fields.

Do you think gravity is dependent on temperature? Are some substances unaffected by gravity? Can you create gravity with an electric current?

I'm not bothered that you don't know these things. But you ought to be man enough to admit it. There are plenty of people, here and elsewhere, that could teach you these things. But to claim to be smarter than everyone else when it's obvious to everyone here (everyone everywhere, I imagine) that's not the case - that is offensive. Try asking a question once in a while. Questions are wonderful things. They get you answers and answers provide you with knowledge. And knowledge is good. Always,
 
Ignoring the moron thread hijack....

I found a much better depiction of the Antarctic circumpolar circulation. It shows just how inclusive the circulations really are.

THermolineCirculationAntarctichubpic_zpsd39d4625.png

The slowing of the major heat transfer mechanisms will undoubtedly result in rapid glaciation..
 
Climatesense-norpag
Here is the summary of the latest updated forecasts and observations as of end July 2014.

1/22/13 NH Forecast

1) The millennial peak is sharp – perhaps 18 years +/-. We have now had 16 years since 1997 with no net warming – and so might expect a sharp drop in a year or two – 2014/16 – with a net cooling by 2035 of about 0.35.Within that time frame however there could well be some exceptional years with NH temperatures +/- 0.25 degrees colder than that.

2) The cooling gradient might be fairly steep down to the Oort minimum equivalent which would occur about 2100. (about 1100 on Fig 5) ( Fig 3 here) with a total cooling in 2100 from the present estimated at about 1.2 +/-.

3) From 2100 on through the Wolf and Sporer minima equivalents with intervening highs to the Maunder Minimum equivalent which could occur from about 2600 – 2700 a further net cooling of about 0.7 degrees could occur for a total drop of 1.9 +/- degrees.

4) The time frame for the significant cooling in 2014 – 2016 is strengthened by recent developments already seen in solar activity. With a time lag of about 12 years between the solar driver proxy and climate we should see the effects of the sharp drop in the Ap Index which took place in 2004/5 in 2016-17.
4/02/13Global Forecast
1 Significant temperature drop at about 2016-17
2 Possible unusual cold snap 2021-22
3 Built in cooling trend until at least 2024
4 Temperature Hadsst3 moving average anomaly 2035 – 0.15
5 Temperature Hadsst3 moving average anomaly 2100 – 0.5
6 General Conclusion – by 2100 all the 20th century temperature rise will have been reversed,
7 By 2650 earth could possibly be back to the depths of another little ice age.
8 The effect of increasing CO2 emissions will be minor but beneficial – they may slightly ameliorate the forecast cooling and help maintain crop yields .
9 Warning !! There are some signs in the Livingston and Penn Solar data that a sudden drop to the Maunder Minimum Little Ice Age temperatures could be imminent – with a much more rapid and economically disruptive cooling than that forecast above which may turn out to be a best case scenario.”

3.2 2014 Updates and Observations..

3.2.1 Updates
a) NH Forecast- item 4. With regard to timing, closer examination of the Ap Index (Fig13) and Neutron Count (Fig.14) would suggest that the sharpest drop in activity is better placed at 2005/6 with the associated sharp temperature drop now forecast at 2017-18.
b) Global Forecast – item1. Significant temperature drop now forecast for 2017-18.
c) Global Forecast – item 9. Another year of flat Livingston and Penn umbral data suggests that a swift decline into a Maunder Minimum is now very unlikely.
3.2.2. Observations.
a) Solar Cycle 24 peak.
During the last year, Solar cycle 24 developed a second and higher Sunspot peak in February 2014 and activity has declined sharply since then. This decline should be reflected in a rapid increase in the Neutron Count in another 4 or 5 months, and the possible beginning of a more pronounced cooling phase. The sharp decline in solar activity since February may also lead to the non-appearance of the much anticipated El Nino.
b) The Polar Vortex Excursions.
I will quote again from the 2010 forecast:
“There will be a steeper temperature gradient from the tropics to the poles so that violent thunderstorms with associated flooding and tornadoes will be more frequent in the USA. At the same time the jet stream will swing more sharply North – South thus local weather in the Northern hemisphere in particular will be generally more variable with occasional more northerly heat waves and more southerly unusually cold snaps”

This forecast was spectacularly confirmed by the early 2014 excursions of the Polar Vortex into the United States. Indeed, as I write this in Houston on July 29, 2014 another unusually early Canadian front has just gone through Houston with heavy rains and thunderstorms. This is a harbinger of weather patterns which will become more frequent on a cooling planet. As the excursions occur later in the spring and begin earlier in the fall, the snow cover finally never melts over the NE of the American continent and after a few thousand years full ice age conditions will develop, as suggested by Steve Goddard:

Confirmation by empirical observed evidence. No modeling involved..

A confirmation is made with empirical evidence, but a forecast is nothing BUT the output of a model
 
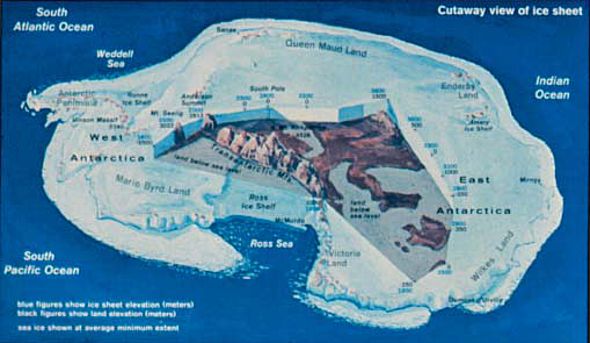
Ocean Changes around Antarctica Similar to what Happened 14 000 Years Ago - Climate Change Weather Blog

The waters surrounding Antarctica have been recently undergoing changes that were similar to what occurred 14,000 years ago, which led to a rapid melting of the Antarctic Ice Sheet and a sudden 10-13 foot rise in global sea level.

590x343_10021846_ex02.jpg


Modeling simulations, which were conducted by the Australian Research Council Centre of Excellence for Climate System Science found that ice sheets and glaciers melted much faster 14,000 years ago when ocean temperatures surrounding Antarctica became more layered with a warm layer of water below a cold surface layer.

The team found that this same layering is occurring once again.

Reality.
 
http://www.gfdl.noaa.gov/news-app/s...nd-greenland-and-antarctica/menu.no/sec./home.

Jianjun Yin, Jonathan T. Overpeck, Stephen M. Griffies, Aixue Hu, Joellen L. Russell, and Ronald J. Stouffer. Nature Geoscience - DOI: 10.1038/NGEO1189.

land_ice.jpg
Recent acceleration of Greenland and Antarctic outlet glaciers and ice flows is closely linked to ocean warming, especially in the subsurface layer. This land ice melt will cause sea level rise.

We find that in response to an increase in atmospheric greenhouse-gas concentrations, the subsurface oceans (200-500 m) surrounding the two polar ice sheets both warm substantially more than has been observed thus far. Model projections suggest that the maximum ocean warming around Greenland will be double the global mean, whereas ocean warming around Antarctica will be only half the global mean (see figure).

A detailed evaluation indicates that the climate mechanisms behind the projected warming are likely realistic and capable of driving substantial increases in ice mass loss and sea level rise in the future. A more accurate simulation and projection of ice sheets and their interactions with the ocean and the atmosphere require refined resolution Earth system models, which resolve fast-moving ice flows and small-scale temperature changes.

More reality.
 

Forum List

Back
Top