UH OH Spaghetti Oh! Hansen says the temps have been flat!

westwall

WHEN GUNS ARE BANNED ONLY THE RICH WILL HAVE GUNS
Gold Supporting Member
Apr 21, 2010
96,576
57,716
2,605
Nevada
Yes, the grand old man has finally been forced to admit that the last ten years have been flat, global tempwise, further he also admits that 2012 was the NINTH warmest on record.

Must suck to be a braindead propagandist like oltrakrtrollingblunderfraud and have the leader of the cult come out and say it's all been a lie.

But, being the nice little useful idiots they are, they'll figure out a way to rationalise it all away.


Summary. Global surface temperature in 2012 was +0.56°C (1°F) warmer than the 1951-1980 base period average, despite much of the year being affected by a strong La Nina. Global temperature thus continues at a high level that is sufficient to cause a substantial increase in the frequency of extreme warm anomalies. The 5-year mean global temperature has been flat for a decade, which we interpret as a combination of natural variability and a slowdown in the growth rate of the net climate forcing.
An update through 2012 of our global analysis1 (Fig. 1) reveals 2012 as having practically the same temperature as 2011, significantly lower than the maximum reached in 2010. These short-term global fluctuations are associated principally with natural oscillations of tropical Pacific sea surface temperatures summarized in the Nino index in the lower part of the figure. 2012 is nominally the 9th warmest year, but it is indistinguishable in rank with several other years, as shown by the error estimate.


So much for the claims of 2012 being the HOTTEST YEAR EVAH! Fools.


http://www.columbia.edu/~jeh1/mailings/2013/20130115_Temperature2012.pdf
 
The wheels are coming off...

medium_WheelsComingOff.jpg
 
you know, at one time Hansen was a pretty good scientist. the whole CAGW thing clouded his judgment.
 
So much for the claims of 2012 being the HOTTEST YEAR EVAH! Fools.

LOLOLOLOLOLOL.....oh walleyed, you are soooo funny.....and sooooooooooo retarded.....

2012 is the hottest year on record in the contiguous US of A, moron. Not the world.

2012 hottest year on record in contiguous U.S., NOAA says
The Washington Post
January 08, 2013
(excerpts)
Temperatures in the contiguous United States last year were the hottest in more than a century of record-keeping, shattering the mark set in 1998 by a wide margin, the federal government announced Tuesday. The average temperature in 2012 was 55.3 degrees, one degree above the previous record and 3.2 degrees higher than the 20th-century average, scientists at the National Oceanic and Atmospheric Administration said. They described the data as part of a longer-term trend of hotter, drier and potentially more extreme weather.
 
US=7% of the world.
Technically, the USA is a bit less than 2% of the total surface area of the planet and since the entire surface area is involved in climate processes, that is probably the better comparison. The US is a little less than 7% of the world's total land surface area but so what? Perhaps you didn't follow what happened on this thread so far. The ol' walleyedretard posted an idiotic OP revealing the fact that he is so clueless about what is happening, he actually imagined that scientists had claimed that 2012 was the hottest year on record 'worldwide' and he had discovered evidence that they really knew that it was only the 9th or 10th hottest year on record. Woo-hoo. Big scandal, I suppose, in his little fantasy world. I then pointed out that, in his usual half-witted way, he had missed the fact that it was only the USA that had just experienced it's hottest year on record, not the world, and that his big 'expose' was just his usual ignorant garbage.


It really doesn't matter as it was a weather pattern that made this possible.(Jet stream being further north)...
Oh...really??? LOLOL.

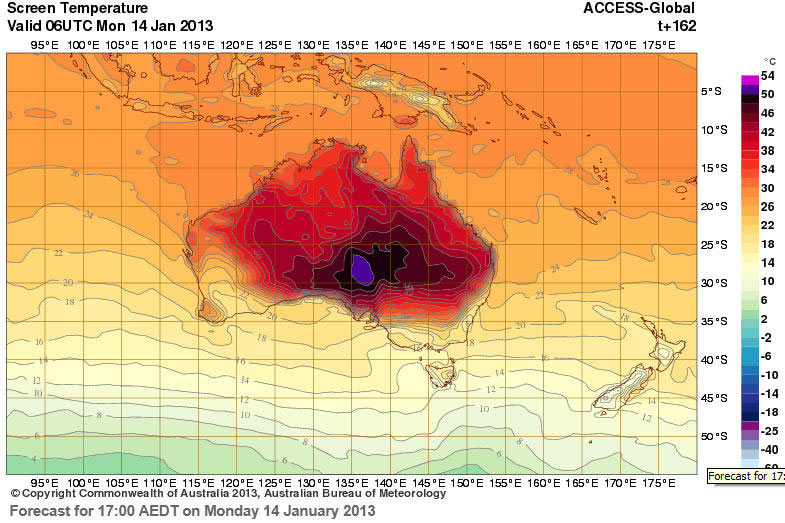
Without even getting into the reasons why the jet stream was supposedly so much further north as to cause that major a heat wave, let me ask you....was the same "weather pattern" that you claim was responsible for last summer's (2012) record breaking heat wave in America, also responsible for all of these events too????

Australian-Bureau-of-Mete-001.jpg

Australian Bureau of Metereology temperature map - with a new colour for 52-54C. Photograph: BOM.
The temperature forecast for next Monday by Australia's Bureau of Meteorology is so unprecedented - over 52°C (125°F) - that it has had to add a new colour to the top of its scale, a suitably incandescent purple. The record for the hottest average day across the nation was set on Monday, at 40.3°C, exceeding a 40-year-old record. "What makes this event quite exceptional is how widespread and intense it's been," said Aaron Coutts-Smith, the weather bureau's climate services manager. "We have been breaking records across all states and territories in Australia over the course of the event so far." Wildfires are raging across New South Wales and Tasmania.
(Guardian)


The Winter 2012 American Heat Wave: "Almost Like Science Fiction" - 03.23.2012
All across the continent, records have been smashed: from the Great Lakes to the Atlantic, a heat wave like nothing we've ever seen before is hitting the U.S. and Canada. This past Wednesday broke records all across the Midwest and Northeast. Some stats:
Chicago has broken high temperature records for nine days in a row--though today is likely to end that streak. The temperature in Chicago this week has been sometimes 30 degrees higher than the average--more similar to June weather than March.
Many Canadian cities including Toronto, Montreal, Halifax, Ottawa, Winnipeg, Quebec City, St. John, Windsor, Hamilton, and London, all broke high-temperature records on Wednesday. St. John's high of 25.4°C (78°F) was higher than any recorded temperature in April.
The low temperatures in Marquette, MI and Mt. Washington, NH, was higher than the record high temperature in the past.
Lake Michigan has a water temperature closer to average June readings than March, reaching into the mid-50s in the middle of the lake.
New York City has had seven days of record-breaking temperatures, with yesterday's high of 78 breaking a 74-year-old record.
Mike Halpert, deputy director of the National Oceanic and Atmospheric Administration’s Climate Prediction Center, called the record-breaking month "mind-boggling."

(Popular Science)


From late July until the second week in August 2010, record heat settled across 772,204 square miles (2 million square kilometers) in Russia and Eastern Europe. In Moscow, the daytime temperatures reached 101 degrees Fahrenheit (38.2 degrees Celsius), in Kiev, nights reached 77 F (25 C), crops were destroyed, fires swept across western Russia, and preliminary estimates now put the Russian death toll at 55,000.
(LiveScience)


The 2006 North American heat wave spread throughout most of the United States and Canada beginning on July 15, 2006, killing at least 225 people. That day the temperature reached 117 °F (47 °C) in Pierre, South Dakota, with many places in South Dakota that hit well into the 120s. A 130 degree temperature (54 °C) was reported at a remote farm in South Dakota.[citation needed] The heat wave went through several distinct periods:
From July 15 to July 22 very high temperatures spread across most all of the United States and Canada. On Monday, July 17, every state except Alaska, Minnesota, and North Dakota recorded temperatures of 90 °F (32 °C) or greater. North Dakota had recorded a temperature of 104 °F (40 °C) the previous day.[4]
From July 23 to July 29 the abnormal heat was concentrated in the West coast and South West deserts. 164 fatalities were reported in California during this period.
From July 29 to August 4 the heat wave moved eastward, causing further fatalities as it progressed.
From August 4 to August 27, high temperatures persisted in the South and Southeast United States.[5] The heat wave finally ended with the progression of a cold front through the Southern Plains.

(Wikipedia)


The 2003 European heat wave was the hottest summer on record in Europe since at least 1540.[1] France was hit especially hard. The heat wave led to health crises in several countries and combined with drought to create a crop shortfall in parts of Southern Europe. Peer reviewed analysis places the European death toll at 70,000.[2]
(Wikipedia)


Spring and summer 2000 - About 140 people died during a heat wave and drought throughout the spring and summer of 2000, report officials with the National Climate Data Center. South-central and southeastern states were hit the hardest. Losses in agriculture and related industries topped $4.8 billion. During the heat wave, some areas experienced as many as 20 more days than usual of temperatures above 90 degrees F.
(CSMonitor)


Summer 1999 - Some 502 deaths and at least $1.2 billion in damage resulted from the summer drought and heat wave that struck the East Coast in particular, estimate officials from the National Climate Data Center. The aftermath included extensive losses in the agriculture industry, and temperatures exceeded those on the record books. In Texas, 24 consecutive days with temperatures above 100 degrees signaled the fourth longest heat wave of its kind on record to that date.
(CSMonitor)


Summer 1998 - At least 200 deaths and as much as $11.3 billion in damages ensued after a severe heat wave struck the nation, particularly the swath from Texas and Oklahoma eastward to North and South Carolina, Georgia and Florida. Cattle died and crops withered, as ranchers and farmers experienced particularly heavy financial losses. The same summer made the record books for severe flooding in China and other parts of the United States; hurricane Bonnie, meanwhile, struck North Carolina and Virginia. The combined worldwide death toll that summer exceeded 3,000.
(CSMonitor)


Summer 1988 - During the summer of 1988, a drought and heat wave affecting the central and eastern portions of the US were responsible for 5,000 to 10,000 deaths, officials estimated, factoring in deaths related to heat stress. The blow to agriculture and related industries totaled about $71.2 billion, making the incident one of the most severe on the “Billion Dollar US Weather Disasters” list, which includes all types of weather-related events and is compiled by the National Climate Data Center.
(CSMonitor)
 
Last edited:
UH OH Spaghetti Oh! Hansen says the temps have been flat!

Yeah, Phil Jones said basically the same thing about a year back.

I don't expect either admission to make a dent in the Chicken Little cult.

Neither Dr. Jones nor Dr. Hansen think that warming has stopped. Denier cultists always try to twist and misinterpret what the scientists are saying.
[ame=http://www.youtube.com/watch?v=NQ39Y_bbOsg]'No statistically significant global warming since 1995' admits Professor Phil Jones - YouTube[/ame]
 
Yeah, Phil Jones said basically the same thing about a year back.

I don't expect either admission to make a dent in the Chicken Little cult.

Neither Dr. Jones nor Dr. Hansen think that warming has stopped. Denier cultists always try to twist and misinterpret what the scientists are saying.
'No statistically significant global warming since 1995' admits Professor Phil Jones - YouTube

LOLOLOL......


Global warming since 1995 'now significant'
BBC News

By Richard Black - Environment correspondent
10 June 2011
(excerpts)
Climate warming since 1995 is now statistically significant, according to Phil Jones, the UK scientist targeted in the "ClimateGate" affair. Last year, he told BBC News that post-1995 warming was not [statistically] significant - a statement still seen on blogs critical of the idea of man-made climate change. But another year of data has pushed the trend past the threshold usually used to assess whether trends are "real". Dr Jones says this shows the importance of using longer records for analysis. By widespread convention, scientists use a minimum threshold of 95% to assess whether a trend is likely to be down to an underlying cause, rather than emerging by chance. If a trend meets the 95% threshold, it basically means that the odds of it being down to chance are less than one in 20. Last year's analysis, which went to 2009, did not reach this threshold; but adding data for 2010 takes it over the line. "The trend over the period 1995-2009 was significant at the 90% level, but wasn't significant at the standard 95% level that people use", Professor Jones told BBC News. "Basically what's changed is one more year [of data]. That period 1995-2009 was just 15 years - and because of the uncertainty in estimating trends over short periods, an extra year has made that trend significant at the 95% level which is the traditional threshold that statisticians have used for many years. It just shows the difficulty of achieving significance with a short time series, and that's why longer series - 20 or 30 years - would be a much better way of estimating trends and getting significance on a consistent basis." Professor Jones' previous comment, from a BBC interview in Febuary 2010, is routinely quoted - erroneously - as demonstration that the Earth's surface temperature is not rising.
 
If AGW were a real science, when the data contradicts the theory, they'd alter or scrap the theory. Because it's a cult, they theaten Jihad on the non-believers
 
So much for the claims of 2012 being the HOTTEST YEAR EVAH! Fools.

LOLOLOLOLOLOL.....oh walleyed, you are soooo funny.....and sooooooooooo retarded.....

2012 is the hottest year on record in the contiguous US of A, moron. Not the world.

2012 hottest year on record in contiguous U.S., NOAA says
The Washington Post
January 08, 2013
(excerpts)
Temperatures in the contiguous United States last year were the hottest in more than a century of record-keeping, shattering the mark set in 1998 by a wide margin, the federal government announced Tuesday. The average temperature in 2012 was 55.3 degrees, one degree above the previous record and 3.2 degrees higher than the 20th-century average, scientists at the National Oceanic and Atmospheric Administration said. They described the data as part of a longer-term trend of hotter, drier and potentially more extreme weather.
Once again I am proven right!

If you remember back when the USA temps were lower than the Global temps, the deniers said only the USA temps were accurate because the USA had the most temp stations, and I predicted that as soon as the USA temps were higher than the Global temps the USA temps would no longer be the most accurate.

Deniers are piss easy to predict.
 
Still trolling...Still blundering....Still no significant warming, according to the Pope of the Chicken Little Cult.. :lol:

Still the stupid ass.

Nine out of the ten hottest years on record in this decade. In spite of a couple strong La Nina's and a low Total Solar Irradiance for a few years. And in 2005 and 2010, the super El Nino record year of 1998 was surpasses, without a significant El Nino. The El Nino of 2010 was weak to moderate, and only lasted the first six months, the last months of 2010 were in La Nina. Yet it was hotter than 1998.

So, let's do a little prognosticating here. I say that the next time that we have a significant El Nino, that the years of 1998, 2005, and 2010 will seem insignificant. Now, you on the other side, who claim that it is cooling, or at least not warming, what do you predict? Got enough balls to come right out and make a prediction?:razz:
 

Forum List

Back
Top