Navigation
Install the app
How to install the app on iOS
Follow along with the video below to see how to install our site as a web app on your home screen.

Note: This feature currently requires accessing the site using the built-in Safari browser.
More options
You are using an out of date browser. It may not display this or other websites correctly.
You should upgrade or use an alternative browser.
You should upgrade or use an alternative browser.
UAH v6
- Thread starter IanC
- Start date
Old Rocks
Diamond Member
Well now, that would, indeed, be good news. Now, Ian, are you going to predict global cooling for this year? LOL
Billy_Bob
Diamond Member
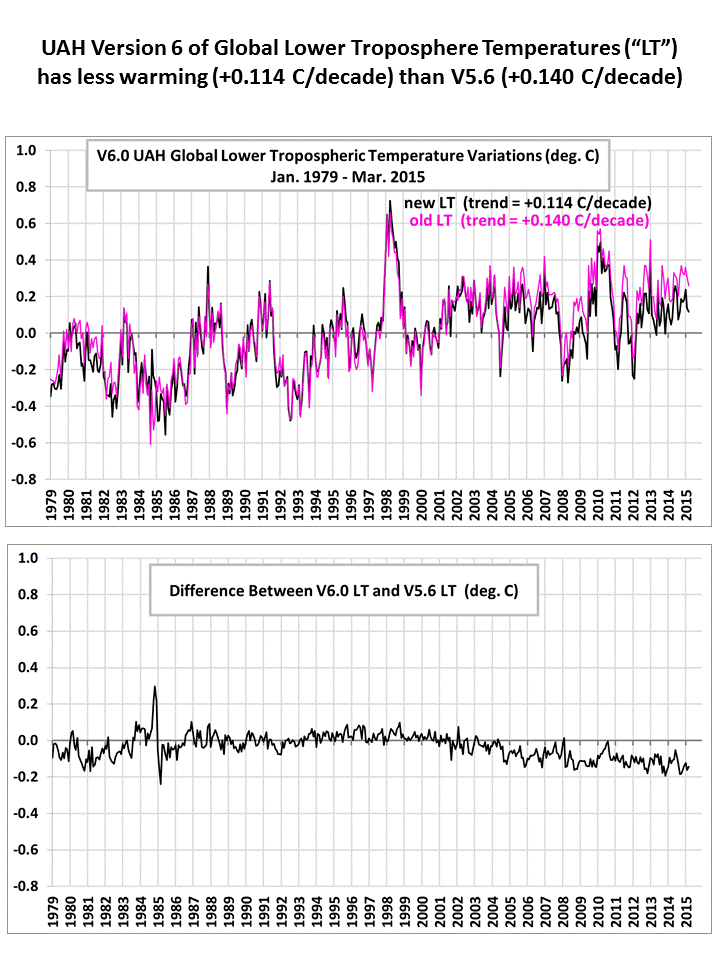
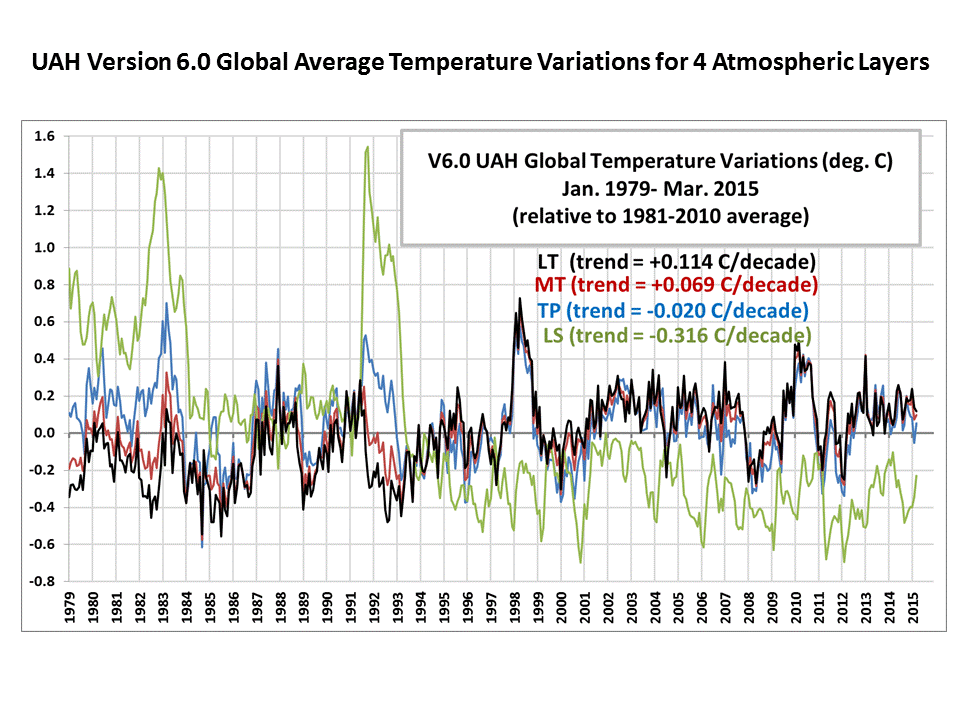
Really? No one with a computer is willing to go to Roy Spencer's web site and post a couple graphs here?
It shows global cooling over the last decade.

Its rather stunning to see the turn of events. every one of their hottest months ever have just been erased by Version 6. Cooling trend is very evident since about 1998. Nice to see it come into line with CRN data.. almost a 100% match.
Source
Billy_Bob
Diamond Member
Well now, that would, indeed, be good news. Now, Ian, are you going to predict global cooling for this year? LOL
NO need to predict it... its already happening...
Old Rocks
Diamond Member
Perhaps what we are seeing is Dr. Spencer's credibility totally erased. Remember the reversed signs.
Billy_Bob
Diamond Member

Its rather stunning the disconnect between the adjusted data sets NOAA and NASA are using and direct satellite measurements.. A full deg C of disconnect.. This will fuel many more inquiries into the data fiddling.
Also the lack of any hot spot in our atmosphere is well defined. Going to be an interesting week or two.
Similar threads
- Replies
- 8
- Views
- 105
- Replies
- 41
- Views
- 507
- Replies
- 257
- Views
- 2K
Latest Discussions
- Replies
- 1
- Views
- 5
- Replies
- 4
- Views
- 15
- Replies
- 12K
- Views
- 1M
Forum List
-
-
-
-
-
Political Satire 8071
-
-
-
-
-
-
-
-
-
-
-
-
-
-
-
-
-
-
-
ObamaCare 781
-
-
-
-
-
-
-
-
-
-
-
Member Usernotes 471
-
-
-
-
-
-
-
-
-
-