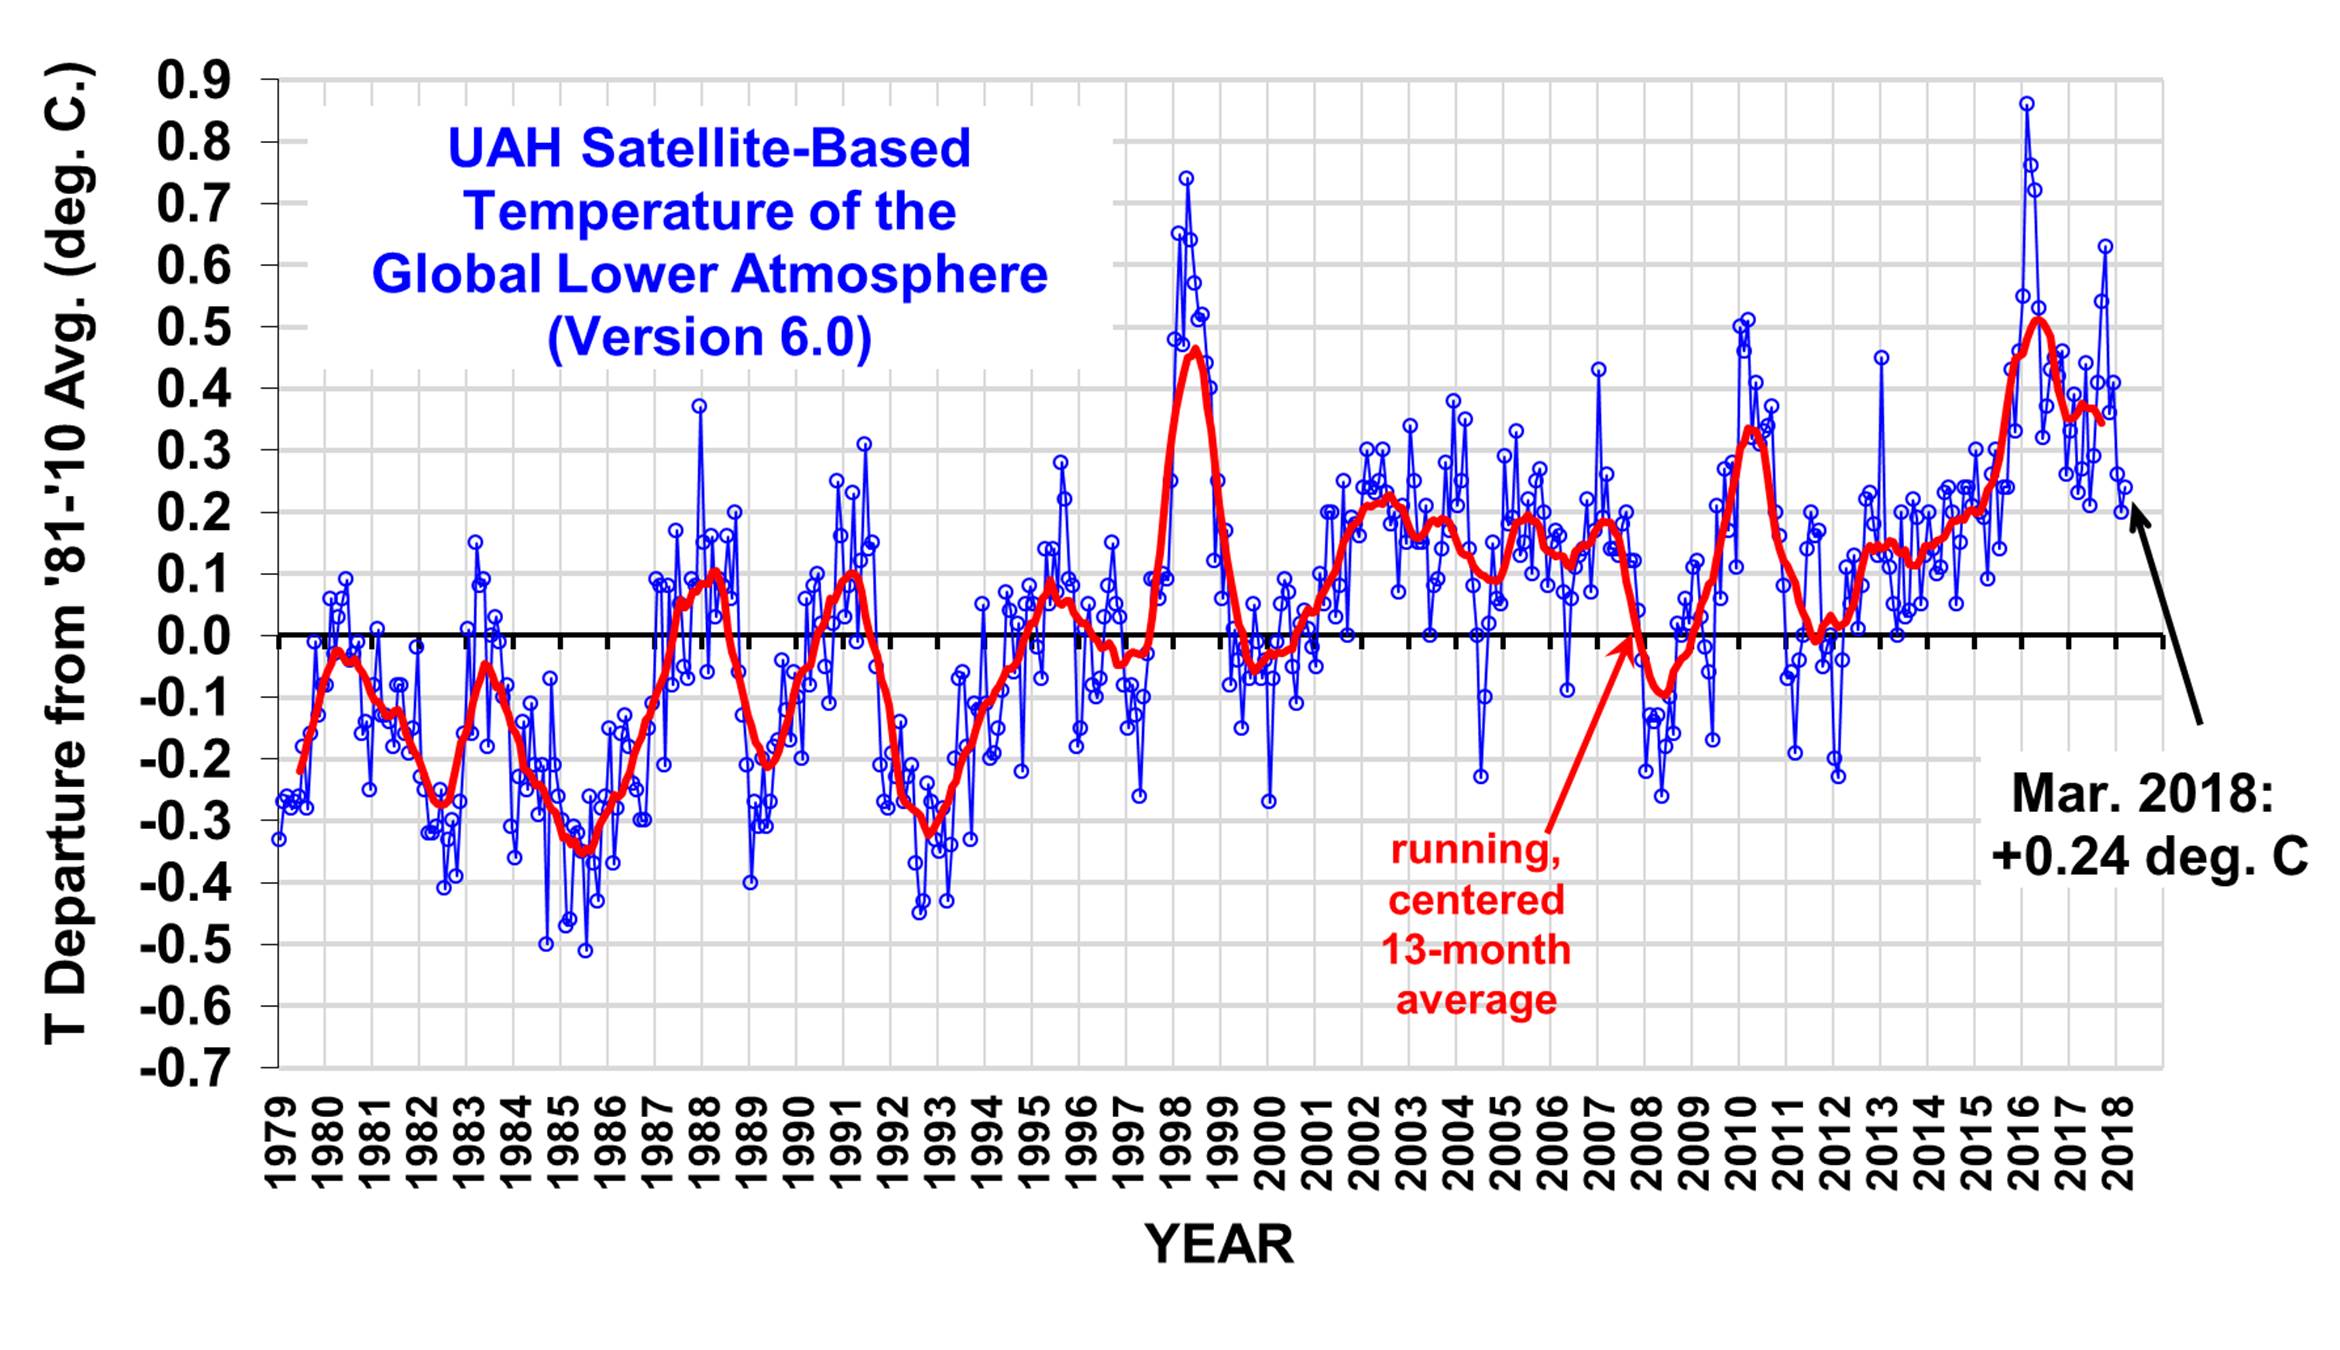
UAH for March 2018

Old Rocks,

Meanwhile you completely ignored what I posted about CH4 and CO2 effects on the atmosphere.

"They are STILL trace gases with a very small IR absorption range as the chart in my previous post clearly shows.

MODTRAN shows that CH4 is a negligible player in the so called "heat budget" plus it doesn't last long in the atmosphere anyway."

What you did was post a deflection to toxicity argument.
 
Since this appears to be a warming thread, perhaps this is relevant

Arctic Sea Ice News and Analysis | Sea ice data updated daily with one-day lag

Did you realize that the Bering Sea ALWAYS melt out by summer?

Did you note the graph appears to be at an all time recorded low?

Did you notice that the low ice level in Bering Sea is the main cause of the over all low ice values?

"Arctic sea ice extent for March 2018 averaged 14.30 million square kilometers (5.52 million square miles), the second lowest in the 1979 to 2018 satellite record. This was 1.13 million square kilometers (436,300 square miles) below the 1981 to 2010 average and 30,000 square kilometers (11,600 square miles) above the record low March extent in 2017. Extent at the end of the month was far below average in the Bering Sea, as it has been for the past several months, and slightly below average in the far northern Atlantic Ocean and Barents Sea. Ice extent was slightly above average in the Sea of Okhotsk."

bolding mine

It doesn't say all time record low.
 
Since this appears to be a warming thread, perhaps this is relevant

Arctic Sea Ice News and Analysis | Sea ice data updated daily with one-day lag

Did you realize that the Bering Sea ALWAYS melt out by summer?

Did you note the graph appears to be at an all time recorded low?

Did you notice that the low ice level in Bering Sea is the main cause of the over all low ice values?

"Arctic sea ice extent for March 2018 averaged 14.30 million square kilometers (5.52 million square miles), the second lowest in the 1979 to 2018 satellite record. This was 1.13 million square kilometers (436,300 square miles) below the 1981 to 2010 average and 30,000 square kilometers (11,600 square miles) above the record low March extent in 2017. Extent at the end of the month was far below average in the Bering Sea, as it has been for the past several months, and slightly below average in the far northern Atlantic Ocean and Barents Sea. Ice extent was slightly above average in the Sea of Okhotsk."

bolding mine

Can't dispute that. Bring Sea is pretty much clear.

Like I said before correctly, it always melts out by summer every single year of the satellite record.

You and others for some reason think this a concern, when it is not..

If it always melts out, why are we seeing such major new lows?

Good question, the Bering's sea ice level is definitely lower than usual this year.

But the over the top warmist worries over the Arctic ice condition continues to amuse me, since it is not a big deal.

It is what it is. See you later

Okaaay
 
Now why is the temperature of the Arctic important?


In a presentation in 2012, Dr. Francis predicted what we have seen in the extreme weather events for the last five years.
 
Now why is the temperature of the Arctic important?


In a presentation in 2012, Dr. Francis predicted what we have seen in the extreme weather events for the last five years.

It's called an interglacial cycle.
 
Nobody is caring about extreme weather events..... so far off people's radar it's stoopid.

About 317 people have ever heard of Dr. Francis..... and to most people wild weather is something they've seen almost every day of their lives. They just don't get hysterical over it. The same people have waaaaaaaaaay too many things on their plate to be worried about stupid shit like couple of bad thunderstorms.:113:
 
Now why is the temperature of the Arctic important?


In a presentation in 2012, Dr. Francis predicted what we have seen in the extreme weather events for the last five years.


There have been NO increase in Tornadoes, Tropical Storm ACE, fewer land falling Hurricanes......

Go look up FLOODS by death numbersl
 
"Version 6.0"? Didn't the first five versions produce the right propaganda? I wonder if the PHD's who live off the taxpayer dole thought to coincide the sun's fluctuating radiation to their satellite data?
 
"Version 6.0"? Didn't the first five versions produce the right propaganda? I wonder if the PHD's who live off the taxpayer dole thought to coincide the sun's fluctuating radiation to their satellite data?

Your ignorance is plain to see since you have no idea WHY there are updated versions.
 
Now why is the temperature of the Arctic important?


In a presentation in 2012, Dr. Francis predicted what we have seen in the extreme weather events for the last five years.

She totally missed why this is happening... 99% is due to El Niño and La Niña and the shifts due to ocean surface heat... My gawd man get a clue... These are well known pattern changes.. Add to that we have been cooling since 2009 and the whole charade falls apart..

Get a clue!


The only time I warms up is when an El-Nino blooms up, otherwise flat to a cooling trend.

Warmists fail to see the obvious why it is the oceans that causes huge spikes of warming in the atmosphere, the oceans waters are barely warming and is cooler than it was 750+ years ago.


Hey ....what happened to the warmist contingent on this thread? :dunno:

Weak....make an implication by starting a thread....then bail.:gay:
 
UAH_LT_1979_thru_March_2018_v6.jpg

UAH Global Temperature Update for March, 2018: +0.24 deg. C « Roy Spencer, PhD

So we had a La Nina, and never got below 0.2. Wonder what the next El Nino will bring? Bet if it is a strong one, it will peak out above 1.2.
Chart shows no warming for 2 decades
 

Forum List

Back
Top