Exactly. And as folks come off Social Security Disability and Food Stamps into entry level jobs, they shift the average down slightly, which is perfectly expected in a solid expansion like this.Very nice. With unemployment this low, this probably means that people are still re-entering.
Wage growth, very nice.
Nice, nice, nice.
.
What the heck are you talking about? You claim to be an expert...and you call that report ‘nice, nice, nice’?
Weekly earnings were down (due to less hours worked). And the hourly earnings were only up a pathetic 6 cents (not even a 1/4 of 1% by my quick math).
Plus, the Household Survey showed a LOSS of employed (103,000 people). How can you praise the unemployment rate on one hand and then COMPLETELY ignore the survey numbers it is based on?
Employment Situation Summary Table B. Establishment data, seasonally adjusted
Employment Situation Summary Table A. Household data, seasonally adjusted
And the Establishment Survey job number (with it’s silly Birth/Death Model) is a semi-joke.
If you are SUCH an ‘expert’...you should be aware of all of the above. Yet you seem blissfully unaware of any bad news in the report.
No offense intended...just sayin’.
I just have to ask, Have you no shame? And, Do you think people are so dumb that they will not easily see how dishonestly selective you are being?
You cherry-pick a tiny handful of stats that are more than offset by other--more important--stats, and then you act like the April jobs numbers are bad. Just absurd.
Wages? Up?
Jobs? 263,000 new jobs.
Female unemployment? All-time low.
Black and Hispanic unemployment? All-time lows.
Unemployment rate? The lowest in 50 YEARS.
The U-6? The lowest in well over a decade.
But, no, you ignore all this and focus on weekly hours and loss of employment. Did your eyes just miss the part where the report said that "Over the month, the number of unemployed persons decreased by 387,000 to 5.8 million"? Did you get that? The number of UNemployed people DEcreased by 387,000.
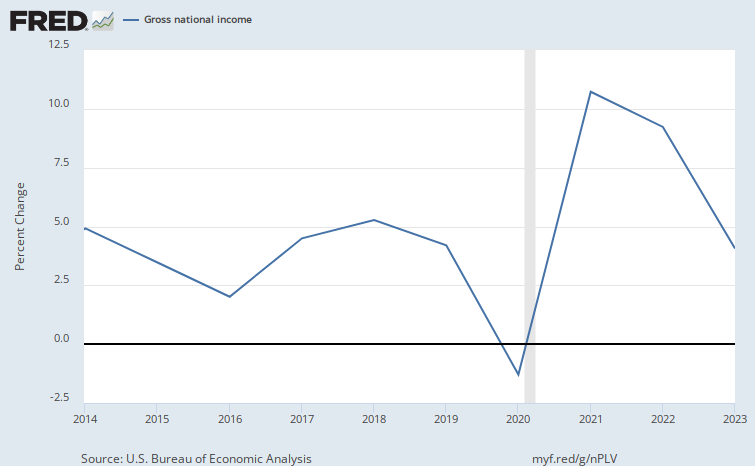
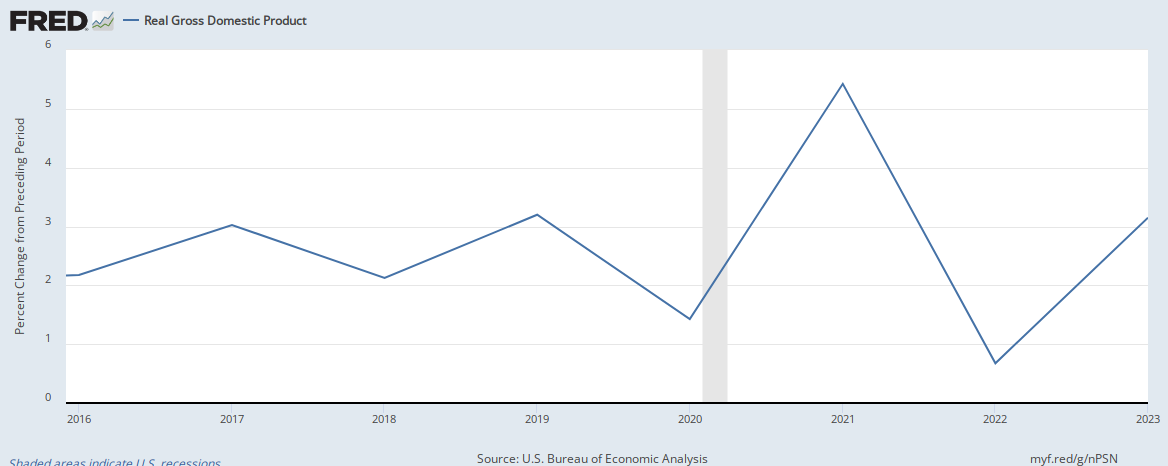
We felt the drop in income we experienced under Obama in 2015 and 2016 as he left, and we felt the shift from falling income to rising income once Trump took over.
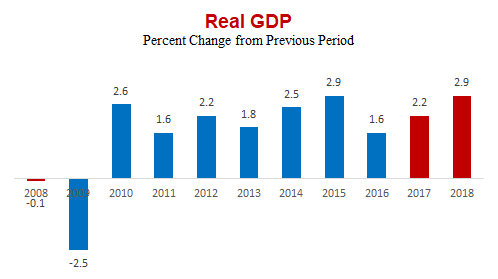
Year end numbers: