McRocket
Gold Member
- Apr 4, 2018
- 5,031
- 707
- 275
- Banned
- #281
"Well Under?" Trump's First full 8 quarters have averaged 2.91%, a 50% increase than Obama's last 8 quarters that averaged 1.94% that the left claimed we should be satisfied with as the "new normal"...Solid expansion? LOL.Exactly. And as folks come off Social Security Disability and Food Stamps into entry level jobs, they shift the average down slightly, which is perfectly expected in a solid expansion like this.Very nice. With unemployment this low, this probably means that people are still re-entering.
Wage growth, very nice.
Nice, nice, nice.
.
What the heck are you talking about? You claim to be an expert...and you call that report ‘nice, nice, nice’?
Weekly earnings were down (due to less hours worked). And the hourly earnings were only up a pathetic 6 cents (not even a 1/4 of 1% by my quick math).
Plus, the Household Survey showed a LOSS of employed (103,000 people). How can you praise the unemployment rate on one hand and then COMPLETELY ignore the survey numbers it is based on?
Employment Situation Summary Table B. Establishment data, seasonally adjusted
Employment Situation Summary Table A. Household data, seasonally adjusted
And the Establishment Survey job number (with it’s silly Birth/Death Model) is a semi-joke.
If you are SUCH an ‘expert’...you should be aware of all of the above. Yet you seem blissfully unaware of any bad news in the report.
No offense intended...just sayin’.
I just have to ask, Have you no shame? And, Do you think people are so dumb that they will not easily see how dishonestly selective you are being?
You cherry-pick a tiny handful of stats that are more than offset by other--more important--stats, and then you act like the April jobs numbers are bad. Just absurd.
Wages? Up?
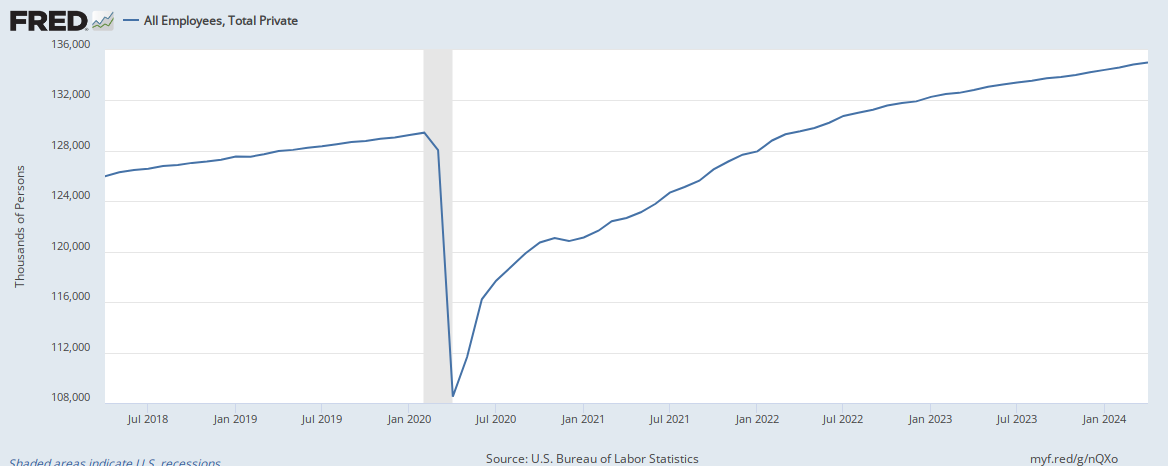
Jobs? 263,000 new jobs.
Female unemployment? All-time low.
Black and Hispanic unemployment? All-time lows.
Unemployment rate? The lowest in 50 YEARS.
The U-6? The lowest in well over a decade.
But, no, you ignore all this and focus on weekly hours and loss of employment. Did your eyes just miss the part where the report said that "Over the month, the number of unemployed persons decreased by 387,000 to 5.8 million"? Did you get that? The number of UNemployed people DEcreased by 387,000.
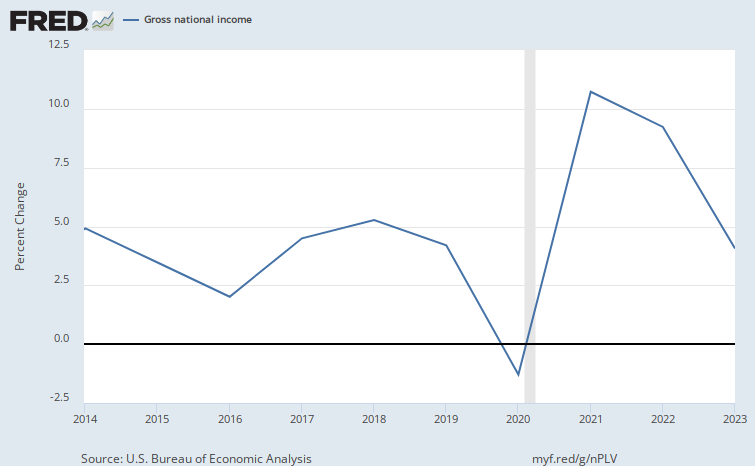
We felt the drop in income we experienced under Obama in 2015 and 2016 as he left, and we felt the shift from falling income to rising income once Trump took over.
Year end numbers:
Well under 3% Real GDP growth...
At the start of Trump's Presidency the "Experts" confidently told us:
If Trump thinks he can get more than 3% economic growth, he's dreaming.
If Trump thinks he can get more than 3% economic growth, he's dreaming
The Nay Sayers:
- The U.S. hasn't had sustained real annual growth (that is, over inflation) of better than 3% since the 1990s, with a brief spurt in 2004 and 2005. Making up the difference from 2% to more than 3% looks like a pipe dream.
- High rates of growth, and the productivity that drives it, are likely distant memories from a bygone era.
- Jason Furman, formerly the chief economist for the Obama White House ("it would require everything to go right … in ways that are either historically unparalleled or toward the upper end of the historical range") and Edward Lazear, who served the same role for George W. Bush ("pray for luck," he advises).
- academic economists such as Northwestern's Robert J. Gordon, who states bluntly in his pessimistic book "The Rise and Fall of American Growth" that U.S. GDP's best years are behind it.
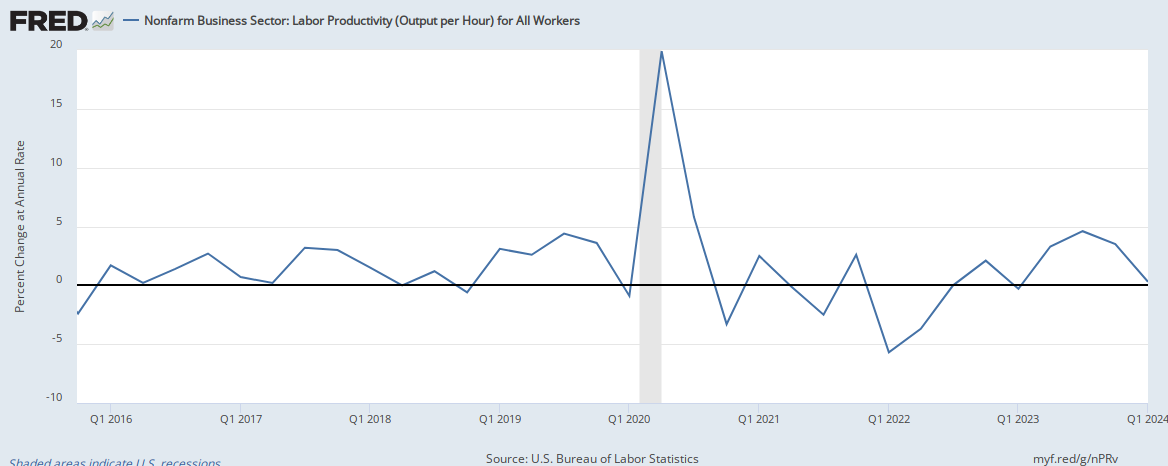
That places the onus on productivity growth. Productivity, defined as real output per hour of labor, is unlikely to pick up to the degree necessary to jolt economic growth above 3% for the long term.
From 2008 through late 2016, according to the Bureau of Labor Statistics, the U.S. was mired in a productivity slump averaging growth of 1.1% a year. That's a pittance compared to the postwar average of 2.3%; the last high point was reached in 2001 through 2007, when growth averaged 2.7% a year.
Yet here we are, in the Splendid Trump Boom with productivity growth rising to 3.6%.
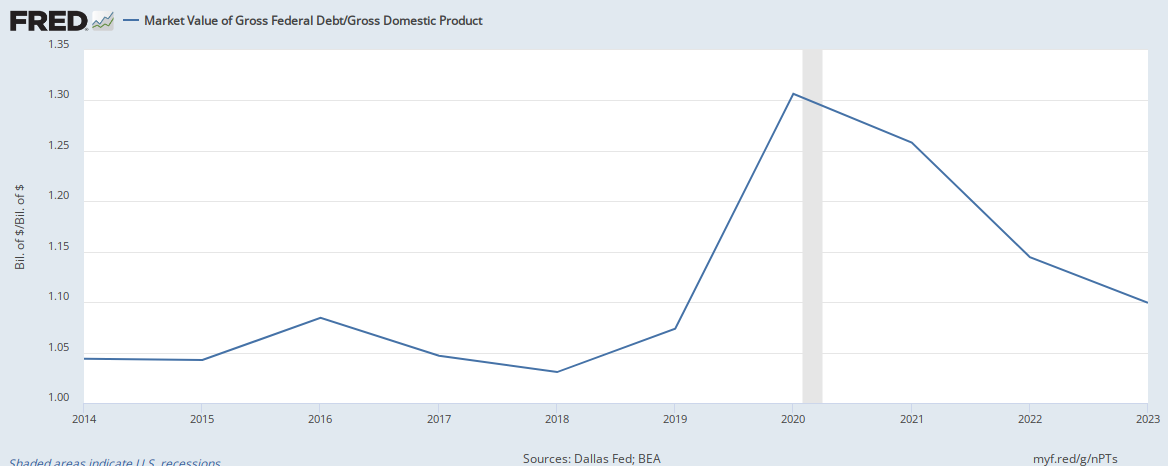
Actually despite the 50% improvement in Real GDP, Trump's increase in the debt is actually a bit improved over Obama's in nominal terms and much much better as a percentage of GDP.... - while running massive fiscal deficits which partially artificially stimulate the economy - is ‘solid expansion’ to you?...
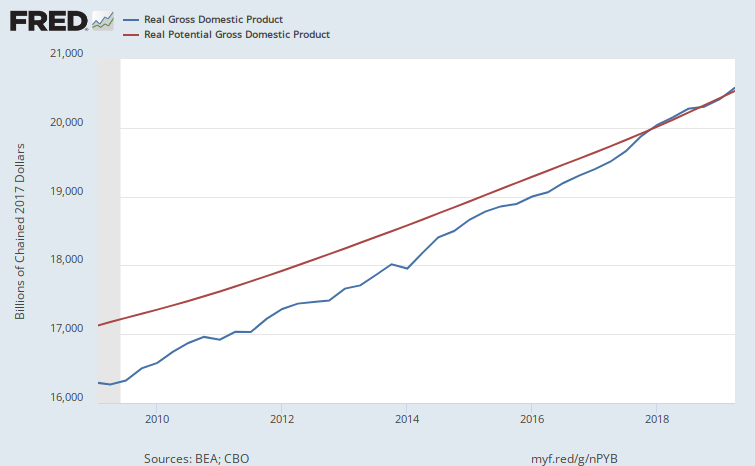
That's a good question. We lagged our potential real GDP growth for many years under Obama. Trump crossed us over that line last year and is still charging ahead with the recent quarter a full 3.2% better than the previous one, he's doing a hell of a job, far better than anyone but him predicted, and he's donating his paycheck to charity, for goodness sake's man, get out of his way and let the man work! When he succeeds, we ALL succeed and that's what this is all about....And just what Real GDP growth level is the minimum for ‘solid expansion’ to you?
FRED Graph
Nobody saw these great times coming, sometimes we just have to shut up and be grateful!
Real GDP growth under Trump in his first 2 years in office (and Q1 2017 counts as Trump took full credit for the January 2017 jobs numbers) is only 2.55%
That is well under 3%...like it or not.
And BTW - I don’t give a shit about Obama - I did not like the way he handled the economy either. So stop wasting both are times and blathering on about Obama, please.
And you dodged my question....what is the minimum GDP growth that you would call ‘solid expansion’?