The truth about CO2 and climate change

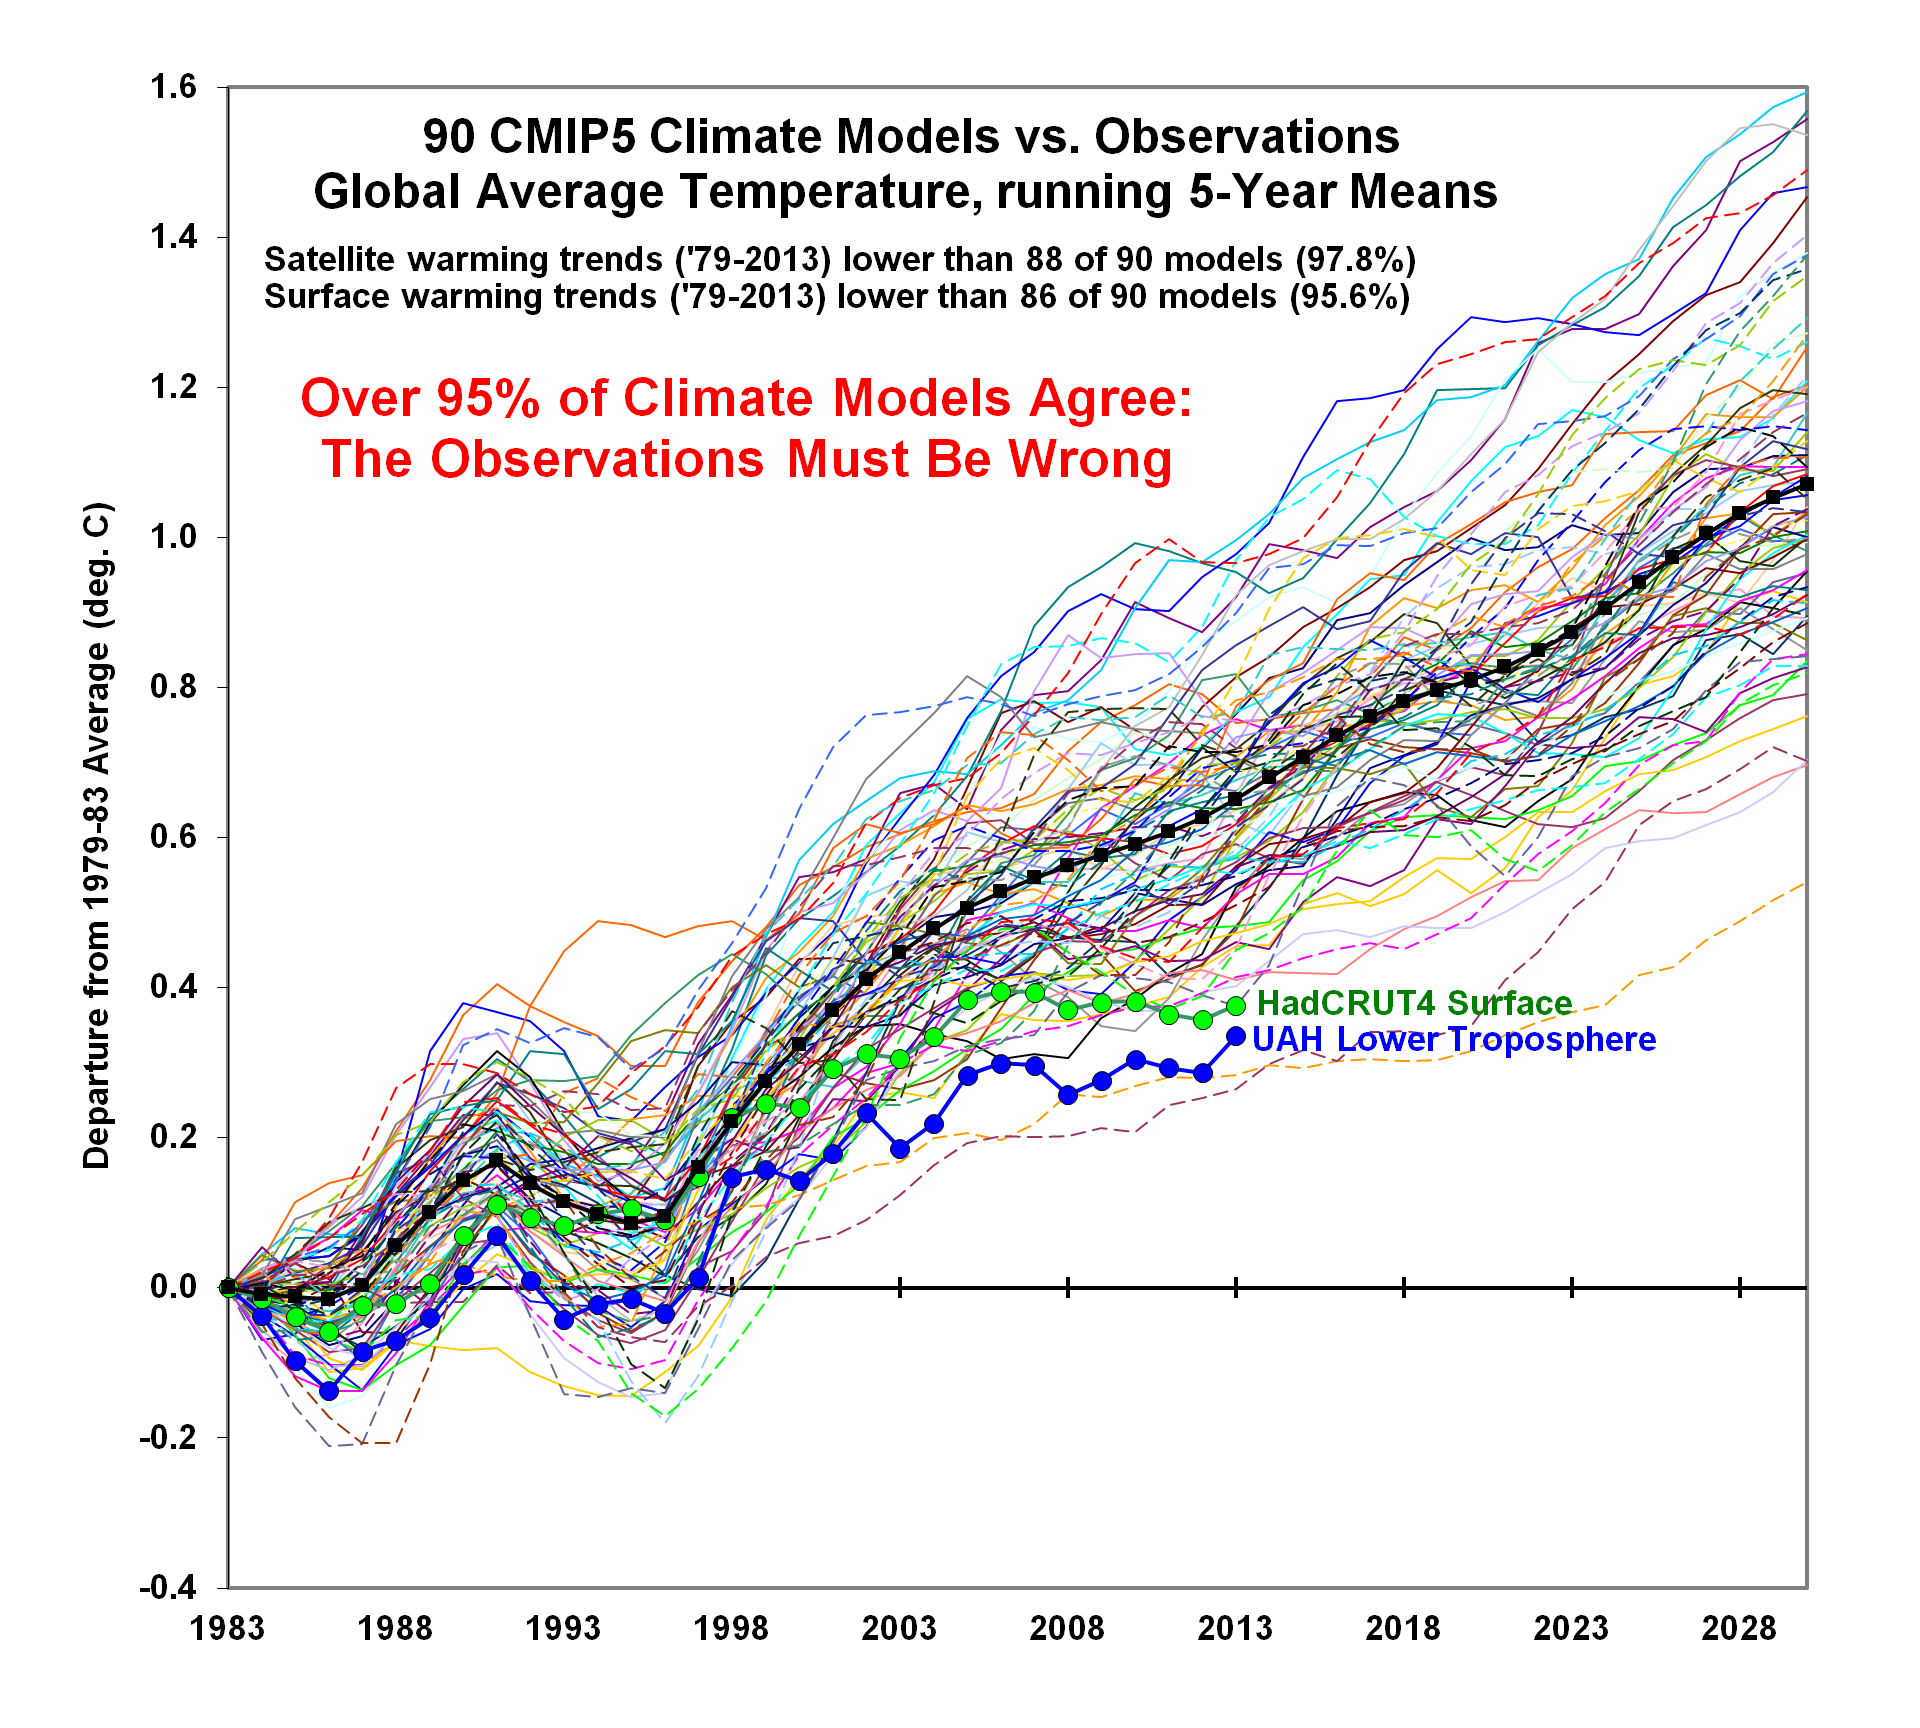
CMIP5-90-models-global-Tsfc-vs-obs-thru-2013.png


yes, in the minds of members of the AGW cult, actual temp measurements are inaccurate and fantasy models are gospel.

and, they also miss that we are talking about tenths of a degree. which could be a calibration error either way.

its a joke, but lets all move into the forest and eat worms to save the planet.
so I still haven't seen what the next gen equipment is that is mattering in the world today. I see discussions about money, but still unclear how money controls the atmosphere! I know CO2 doesn't, and to date, still no experiment. So what is their solution? What is the get out of jail card? Where is it?


exactly, not one liberal will tell you what it is that they want mankind to do.

here's a chance libs, tell us specifically what you want the people of planet earth to do to save the planet from "climate change"
BTW, I hate freacken cold weather!!!! I hate it. I want global warming. Where is it at? Oh yeah, Australia.
 

As if solar cells kill birds. How stupid is that???

I see you are on a par with Franco in intelligence.....you want to know how STUPID you are.... how about 900 DEGREES stupid!!!


Solar cells do not harm birds. Solar reflectors do. What are depicted in the cartoon are solar cell panels. But since you "publicans" are so concerned for the welfare of birds, how many of you have our cat(s) spayed or nutered and kept in doors so they don't kill birds? Because domestic cats kill far more birds than any human activitiy. And yet you people don't seem to be concerned at all about that fact.


a cartoon doesnt have to be factually correct, it has to get the point across in a concise and hopefully funny manner. this one did.

deflection to domestic cats is pretty lame in a conversation about global warming.

For-the-Birds-600-AEA.jpg
 
The myth:

BTW, the US is seeing record cold temps this year,

The reality:

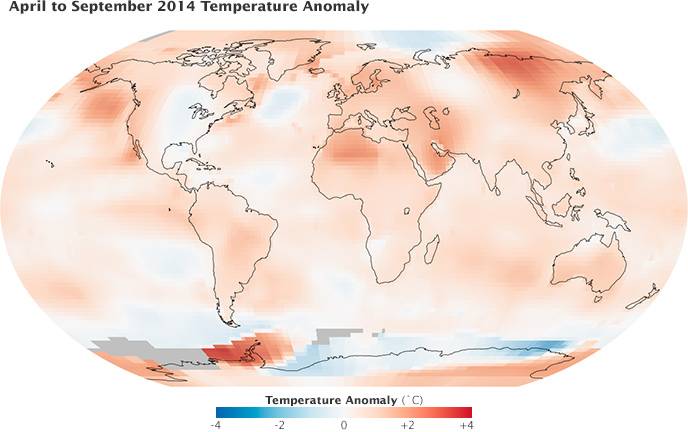
You may have heard that September 2014 was the warmest September ever recorded and that the past six months were the hottest April through September in 130 years of records. NASA Earth Observatory readers sometimes ask: How much does it matter when a monthly or yearly temperature record is broken? And where does global temperature data come from?

For instance, the map above depicts temperature anomalies, or changes from the norm, between April and September 2014; it does not show absolute temperatures. Reds and blues show how much warmer or cooler each area was during that period in 2014 compared to an averaged base period of the same months from 1951–1980.

temperature_gis_2014_04-09.jpg


NASA GISS Research Features Rising Temperatures A Month Versus a Decade
The out put of a MODEL without basis in reality. with all the added adjustments they have made over the years... Garbage!

Models are small facsimilies of the real thing. As such, they certainly do have a basis in reality. Even NASA uses models when designing spaceships and missions. If they didn't, they'd be back in the 1950s with you.
Models are only as accurate as knowing all the variables. We are not even close to having all of earths "variables" thus the models are crap! Hell these people use a static number for water vapor which can change by 70% in minuets over large areas. Not modeling the 95% of GHG's is a fools errand!
 
The out put of a MODEL without basis in reality. with all the added adjustments they have made over the years... Garbage!

Then look at real world measurements - look at glaciers, rising sea levels or the melting Arctic Ice.

But no - you're happy with your head in the sand and your fingers in your ears, fantasising about politics.

Fascinating, look at real world measurement unadjusted by the men purporting the lie show COOLING!

uscrn_average_conus_jan2004-april20141.png


I wonder why NOAA and NASA are hiding USCRN data from view.... Because it shows their adjustments lies...
 

As if solar cells kill birds. How stupid is that???

I see you are on a par with Franco in intelligence.....you want to know how STUPID you are.... how about 900 DEGREES stupid!!!


Solar cells do not harm birds. Solar reflectors do. What are depicted in the cartoon are solar cell panels. But since you "publicans" are so concerned for the welfare of birds, how many of you have our cat(s) spayed or nutered and kept in doors so they don't kill birds? Because domestic cats kill far more birds than any human activitiy. And yet you people don't seem to be concerned at all about that fact.


a cartoon doesnt have to be factually correct, it has to get the point across in a concise and hopefully funny manner. this one did.

deflection to domestic cats is pretty lame in a conversation about global warming.

For-the-Birds-600-AEA.jpg


Except that the point in the cartoon was that solar power cells kill birds. Except that they don't. So the only thing funny about it was how ill-informed the author is about solar power and how silly it is that people like you find it to be funny.
 
The myth:

BTW, the US is seeing record cold temps this year,

The reality:

You may have heard that September 2014 was the warmest September ever recorded and that the past six months were the hottest April through September in 130 years of records. NASA Earth Observatory readers sometimes ask: How much does it matter when a monthly or yearly temperature record is broken? And where does global temperature data come from?

For instance, the map above depicts temperature anomalies, or changes from the norm, between April and September 2014; it does not show absolute temperatures. Reds and blues show how much warmer or cooler each area was during that period in 2014 compared to an averaged base period of the same months from 1951–1980.

temperature_gis_2014_04-09.jpg


NASA GISS Research Features Rising Temperatures A Month Versus a Decade
The out put of a MODEL without basis in reality. with all the added adjustments they have made over the years... Garbage!

Models are small facsimilies of the real thing. As such, they certainly do have a basis in reality. Even NASA uses models when designing spaceships and missions. If they didn't, they'd be back in the 1950s with you.
Models are only as accurate as knowing all the variables. We are not even close to having all of earths "variables" thus the models are crap! Hell these people use a static number for water vapor which can change by 70% in minuets over large areas. Not modeling the 95% of GHG's is a fools errand!

Have you ever used one of these models (or any scientific model, for that matter)?
 
The out put of a MODEL without basis in reality. with all the added adjustments they have made over the years... Garbage!

Then look at real world measurements - look at glaciers, rising sea levels or the melting Arctic Ice.

But no - you're happy with your head in the sand and your fingers in your ears, fantasising about politics.

Fascinating, look at real world measurement unadjusted by the men purporting the lie show COOLING!

uscrn_average_conus_jan2004-april20141.png


I wonder why NOAA and NASA are hiding USCRN data from view.... Because it shows their adjustments lies...

Wattsup? Really? Bhwahahahahahahahaha!
 

As if solar cells kill birds. How stupid is that???

I see you are on a par with Franco in intelligence.....you want to know how STUPID you are.... how about 900 DEGREES stupid!!!


Solar cells do not harm birds. Solar reflectors do. What are depicted in the cartoon are solar cell panels. But since you "publicans" are so concerned for the welfare of birds, how many of you have our cat(s) spayed or nutered and kept in doors so they don't kill birds? Because domestic cats kill far more birds than any human activitiy. And yet you people don't seem to be concerned at all about that fact.


a cartoon doesnt have to be factually correct, it has to get the point across in a concise and hopefully funny manner. this one did.

deflection to domestic cats is pretty lame in a conversation about global warming.

For-the-Birds-600-AEA.jpg


Except that the point in the cartoon was that solar power cells kill birds. Except that they don't. So the only thing funny about it was how ill-informed the author is about solar power and how silly it is that people like you find it to be funny.

nope, it was funny!!!
 
The out put of a MODEL without basis in reality. with all the added adjustments they have made over the years... Garbage!

Then look at real world measurements - look at glaciers, rising sea levels or the melting Arctic Ice.

But no - you're happy with your head in the sand and your fingers in your ears, fantasising about politics.

Fascinating, look at real world measurement unadjusted by the men purporting the lie show COOLING!

uscrn_average_conus_jan2004-april20141.png


I wonder why NOAA and NASA are hiding USCRN data from view.... Because it shows their adjustments lies...

Wattsup? Really? Bhwahahahahahahahaha!
what's up Doc to you!
 
As if solar cells kill birds. How stupid is that???

I see you are on a par with Franco in intelligence.....you want to know how STUPID you are.... how about 900 DEGREES stupid!!!


Solar cells do not harm birds. Solar reflectors do. What are depicted in the cartoon are solar cell panels. But since you "publicans" are so concerned for the welfare of birds, how many of you have our cat(s) spayed or nutered and kept in doors so they don't kill birds? Because domestic cats kill far more birds than any human activitiy. And yet you people don't seem to be concerned at all about that fact.


a cartoon doesnt have to be factually correct, it has to get the point across in a concise and hopefully funny manner. this one did.

deflection to domestic cats is pretty lame in a conversation about global warming.

For-the-Birds-600-AEA.jpg


Except that the point in the cartoon was that solar power cells kill birds. Except that they don't. So the only thing funny about it was how ill-informed the author is about solar power and how silly it is that people like you find it to be funny.

nope, it was funny!!!


Which proves my point, Thank you.
 
The out put of a MODEL without basis in reality. with all the added adjustments they have made over the years... Garbage!

Then look at real world measurements - look at glaciers, rising sea levels or the melting Arctic Ice.

But no - you're happy with your head in the sand and your fingers in your ears, fantasising about politics.

Fascinating, look at real world measurement unadjusted by the men purporting the lie show COOLING!

uscrn_average_conus_jan2004-april20141.png


I wonder why NOAA and NASA are hiding USCRN data from view.... Because it shows their adjustments lies...

Wattsup? Really? Bhwahahahahahahahaha!
what's up Doc to you!

That you people believe the nonsense posted by a politically drive former dj over that of real scientists would be funny as hell if it wasn't such a sad statement on the condition of our edu(ma)cation system.
 

As if solar cells kill birds. How stupid is that???

I see you are on a par with Franco in intelligence.....you want to know how STUPID you are.... how about 900 DEGREES stupid!!!


Solar cells do not harm birds. Solar reflectors do. What are depicted in the cartoon are solar cell panels. But since you "publicans" are so concerned for the welfare of birds, how many of you have our cat(s) spayed or nutered and kept in doors so they don't kill birds? Because domestic cats kill far more birds than any human activitiy. And yet you people don't seem to be concerned at all about that fact.


a cartoon doesnt have to be factually correct, it has to get the point across in a concise and hopefully funny manner. this one did.

deflection to domestic cats is pretty lame in a conversation about global warming.

For-the-Birds-600-AEA.jpg


Except that the point in the cartoon was that solar power cells kill birds. Except that they don't. So the only thing funny about it was how ill-informed the author is about solar power and how silly it is that people like you find it to be funny.


no, the point is that some forms of renewables like solar collectors and wind farms kill birds. you cannot show those to scale so the artist depicted solar panels. the cartoon is funny and easily understandable. the snow is a wonderful touch.


If that were true, the author would have depicted solar collectors and wind farms. I don't see those depicted in this cartoon. Do you? Cats and power lines kill far more birds than solar collectors or wind farms. But then, you knew that already.
 

As if solar cells kill birds. How stupid is that???

I see you are on a par with Franco in intelligence.....you want to know how STUPID you are.... how about 900 DEGREES stupid!!!


Solar cells do not harm birds. Solar reflectors do. What are depicted in the cartoon are solar cell panels. But since you "publicans" are so concerned for the welfare of birds, how many of you have our cat(s) spayed or nutered and kept in doors so they don't kill birds? Because domestic cats kill far more birds than any human activitiy. And yet you people don't seem to be concerned at all about that fact.


a cartoon doesnt have to be factually correct, it has to get the point across in a concise and hopefully funny manner. this one did.

deflection to domestic cats is pretty lame in a conversation about global warming.

For-the-Birds-600-AEA.jpg


Except that the point in the cartoon was that solar power cells kill birds. Except that they don't. So the only thing funny about it was how ill-informed the author is about solar power and how silly it is that people like you find it to be funny.


windmills kill birds, idiot. the cartoon was poking fun at the entire hypocrisy of the alternate power zealots.
 
The myth:

BTW, the US is seeing record cold temps this year,

The reality:

You may have heard that September 2014 was the warmest September ever recorded and that the past six months were the hottest April through September in 130 years of records. NASA Earth Observatory readers sometimes ask: How much does it matter when a monthly or yearly temperature record is broken? And where does global temperature data come from?

For instance, the map above depicts temperature anomalies, or changes from the norm, between April and September 2014; it does not show absolute temperatures. Reds and blues show how much warmer or cooler each area was during that period in 2014 compared to an averaged base period of the same months from 1951–1980.

temperature_gis_2014_04-09.jpg


NASA GISS Research Features Rising Temperatures A Month Versus a Decade
The out put of a MODEL without basis in reality. with all the added adjustments they have made over the years... Garbage!

Models are small facsimilies of the real thing. As such, they certainly do have a basis in reality. Even NASA uses models when designing spaceships and missions. If they didn't, they'd be back in the 1950s with you.
Models are only as accurate as knowing all the variables. We are not even close to having all of earths "variables" thus the models are crap! Hell these people use a static number for water vapor which can change by 70% in minuets over large areas. Not modeling the 95% of GHG's is a fools errand!

Have you ever used one of these models (or any scientific model, for that matter)?
I have used many models and once they are proven failure I move on. The predictive stage is always enlightening. Out of 126 models NONE of them pass the statistical analysis and fail. Every single climate model to date fails.
Model forcasts vs reality.JPG


Having morons want to stop fossil fuel use on a model that is not predictive of anything is a fools errand. Note that this graph indicates IPCC model C or the lowest predictive sets of models. All other models in both the A and B sets are so grossly out of line they are considered outliers when challenged against reality.
 
The out put of a MODEL without basis in reality. with all the added adjustments they have made over the years... Garbage!

Then look at real world measurements - look at glaciers, rising sea levels or the melting Arctic Ice.

But no - you're happy with your head in the sand and your fingers in your ears, fantasising about politics.

Fascinating, look at real world measurement unadjusted by the men purporting the lie show COOLING!

uscrn_average_conus_jan2004-april20141.png


I wonder why NOAA and NASA are hiding USCRN data from view.... Because it shows their adjustments lies...

Wattsup? Really? Bhwahahahahahahahaha!

One hell of a lot more reliable than Wiki or SKS..
 
The myth:

The reality:

You may have heard that September 2014 was the warmest September ever recorded and that the past six months were the hottest April through September in 130 years of records. NASA Earth Observatory readers sometimes ask: How much does it matter when a monthly or yearly temperature record is broken? And where does global temperature data come from?

For instance, the map above depicts temperature anomalies, or changes from the norm, between April and September 2014; it does not show absolute temperatures. Reds and blues show how much warmer or cooler each area was during that period in 2014 compared to an averaged base period of the same months from 1951–1980.

temperature_gis_2014_04-09.jpg


NASA GISS Research Features Rising Temperatures A Month Versus a Decade
The out put of a MODEL without basis in reality. with all the added adjustments they have made over the years... Garbage!

Models are small facsimilies of the real thing. As such, they certainly do have a basis in reality. Even NASA uses models when designing spaceships and missions. If they didn't, they'd be back in the 1950s with you.
Models are only as accurate as knowing all the variables. We are not even close to having all of earths "variables" thus the models are crap! Hell these people use a static number for water vapor which can change by 70% in minuets over large areas. Not modeling the 95% of GHG's is a fools errand!

Have you ever used one of these models (or any scientific model, for that matter)?

I have used many models and once they are proven failure I move on.

Oh really? What models have you used? What code was used to create the models? Can you provide the database you used to create these models you claim to have used? Or are you confused and thought today was make up shit Thursday?
 
The out put of a MODEL without basis in reality. with all the added adjustments they have made over the years... Garbage!

Then look at real world measurements - look at glaciers, rising sea levels or the melting Arctic Ice.

But no - you're happy with your head in the sand and your fingers in your ears, fantasising about politics.

Fascinating, look at real world measurement unadjusted by the men purporting the lie show COOLING!

uscrn_average_conus_jan2004-april20141.png


I wonder why NOAA and NASA are hiding USCRN data from view.... Because it shows their adjustments lies...

Wattsup? Really? Bhwahahahahahahahaha!

One hell of a lot more reliable than Wiki or SKS..

You should take that comedy routine to Vegas. I'm sure you will get a lot of laughs.

How about you and fagetti hair ball show me what 120ppm has done. Be specific and show how you determined mans contribution, how it has affected climactic systems, and how you determined what effect it had.

I'll wait... Ive asked this of every single alarmist on this board and to date not one of the little alarmists have produced even a wiff of science. They have produced a whole lot of shit and smelly crap but not a lick of science.
 
Contributions to accelerating atmospheric CO2 growth from economic activity, carbon intensity, and efficiency of natural sinks
  1. Josep G. Canadell a , b ,
  2. Corinne Le Quéré c , d ,
  3. Michael R. Raupach a ,
  4. Christopher B. Field e ,
  5. Erik T. Buitenhuis c ,
  6. Philippe Ciais f ,
  7. Thomas J. Conway g ,
  8. Nathan P. Gillett c ,
  9. R. A. Houghton h , and
  10. Gregg Marland i , j
Author Affiliations

  1. Edited by William C. Clark, Harvard University, Cambridge, MA, and approved September 17, 2007 (received for review March 27, 2007)
  1. Abstract
  2. Full Text
  3. Authors & Info
  4. Figures
  5. SI
  6. Metrics
  7. Related Content
  8. PDF
  9. PDF + SI

Abstract
The growth rate of atmospheric carbon dioxide (CO2), the largest human contributor to human-induced climate change, is increasing rapidly. Three processes contribute to this rapid increase. Two of these processes concern emissions. Recent growth of the world economy combined with an increase in its carbon intensity have led to rapid growth in fossil fuel CO2 emissions since 2000: comparing the 1990s with 2000–2006, the emissions growth rate increased from 1.3% to 3.3% y −1. The third process is indicated by increasing evidence (P = 0.89) for a long-term (50-year) increase in the airborne fraction (AF) of CO2emissions, implying a decline in the efficiency of CO2 sinks on land and oceans in absorbing anthropogenic emissions. Since 2000, the contributions of these three factors to the increase in the atmospheric CO2growth rate have been ≈65 ± 16% from increasing global economic activity, 17 ± 6% from the increasing carbon intensity of the global economy, and 18 ± 15% from the increase in AF. An increasing AF is consistent with results of climate–carbon cycle models, but the magnitude of the observed signal appears larger than that estimated by models. All of these changes characterize a carbon cycle that is generating stronger-than-expected and sooner-than-expected climate forcing.

Real scientists research, not flap-yap pulled out of your asshole, Billy Boob.
 
Long-term observations of atmospheric CO2 and carbon isotopes at continental sites in Germany - LEVIN - 2002 - Tellus B - Wiley Online Library

Long-term observations of atmospheric CO2 and carbon isotopes at continental sites in Germany

  1. INGEBORG LEVIN†,
  2. ROLF. GRAUL and
  3. 1 NEIL B. A. TRIVETT 2


Abstract

A network for regional atmospheric CO2 observations had already been established in Germany by 1972, consisting of 5 stations with basically different characteristics: Westerland, a coastal station at the North Sea, 2 regional stations, Waldhof and Deuselbach, as well as 2 mountain stations, Brotjacklriegel at the eastern boarder of Germany and Schauinsland in the Black Forest. In addition to CO2concentration observations, from 1977 onwards quasi-continuous 13CO2 and 14CO2 measurements were performed on samples from the Schauinsland site, and for the short period 1985-1988, 14CO2 measurements were also made on Westerland samples. CO2 data selection based on wind velocity allows for an estimate of the representative continental CO2 level over Europe. The peak-to-peak amplitude of the seasonal cycles is between 12.1 ppmv (Schauinsland) and 17.6 ppmv (Waldhof). The phase of the seasonal cycles at the German sites is shifted if compared to maritime background sites with the concentration maxima occuring already between beginning of February and beginning of April, the minima in August. The long-term mean CO2 increase rate in the last 20 years at Westerland and Schauinsland is 1.49 and 1.48 ppmv yr−1, respectively. The mean δ13C of the seasonal source CO2 at Schauinsland is calculated from unselected δ13C and CO2 data to be − 25.1‰. From the 14C observations in unselected CO2, we derive yearly mean fossil fuel contributions at Westerland of 4 ppmv, and at Schauinsland of only 2.5 ppmv. Based on the seasonality of the fossil fuel CO2 component at Schauinsland and on concurrently observed atmospheric 222Radon activities, we derive a seasonal amplitude of the fossil fuel CO2source which is higher by a factor of 3 compared to emission estimates for Europe.

Of course, these are real scientists writing these articles, not internet pretenders like you, Billy Boob.
 

Forum List

Back
Top