Dang......just imagine if we get a SUPER-DUPER HYPER moon?!!! Well then we're really fucked!!
Well then we're really fucked!!Follow along with the video below to see how to install our site as a web app on your home screen.

Note: This feature currently requires accessing the site using the built-in Safari browser.
Well then we're really fucked!!Can you help me out with your math... if the sea level is rising by about three millimeters per year (which I agree with BTW) how much will the sea rise by the year 2100?The Supermoon and Global Warming: A Taste of Things to Come
The Supermoon, Global Warming, and Flooding: A Taste of Things to Come
There is one real thing about the “Supermoon”: It causes flooding. But it needs help in the form of global warming.
I wrote about the so-called “Supermoon” on Monday. The basic idea is that we get a “Suupermoon” when the Moon is full at the same time it’s also at its closest point to Earth in its orbit. According to the lore, the Moon will look bigger and be brighter.
While technically true, these claims tend to be overhyped and breathless, leaving people thinking they’ll see a ginormous Moon in the sky. That’s not the case; as I point out in the article earlier this week the “Supermoon” is only about 10 percent closer than it is when it’s at apogee (the farthest point in its orbit from Earth). You’d never notice the difference in size unless you measure it. It does get brighter, by about 20 - 30 percent, which again is tough to notice on your own.
But there is one thing I didn’t mention in that article, and this is a very real and potentially disastrous effect: Tides.
The Rising Seas
If things were normal, that would be bad enough. Coastal areas prone to flooding see higher tides twice a month due to spring tides, and also higher tides once a month from the proxigean tides. When they line up it’s worse, but generally not catastrophic.
…nature itself will amplify it more and more, year by year. Global warming is making that inevitable.
Unless, that is, a third force comes along. For example, if this happens when there’s a storm, off shore, things can get very bad. Low-pressure systems (like hurricanes or just big storms) draw water toward their centers. If one comes ashore, this can create a storm surge, inundating low-lying areas.
But there’s yet another factor here, and it’s the most pernicious of all: sea level rise.
Global warming is melting ice at the poles (yes, at both poles), and also causing water in the oceans to expand. This is causing the sea levels to rise up over time, by about three millimeters per year. That may not sound like much, but it adds up, year after year. It’s risen 85 mm — over three inches — just since 1993!
Sea level rise measured by satellite since 1993.
NASA / Goddard Space Flight Center
As Tamino points out at the Open Mind blog, this alone is enough to cause flooding in coastal areas like Miami and Boston during a normal high tide.
Proxigean tides aren’t normal; they are extra strong. That’s why the NOAA issued a coastal flood warning not just for Monday but for this whole week up until tonight. It’s not until then that the Moon moves away enough both from the Earth and the Earth/Sun line to weaken tides sufficiently to relent on flooding.
But there was flooding, in Portland, Maine, Charleston, South Carolina, and many other locations. From what I can find it was bad but not devastating. It’s what Tamino calls nuisance flooding, and — pardon the expression — it’s on the rise.
In other words, and to be very clear: Global warming is causing sea level rise, which is causing more flooding all the time, and it will get worse. A lot worse.
Adding a bunch of good science today and news.
IF it is linear with no increases in rate, which is extremely unlikely, between the time frame of 2017 to 2100 = 83 years...83 times 3mm per year = 249mm of sea level rise or 9.8" inches globally...
Some areas around the gulf, east coast and western Pacific are rising far faster(2-3 times as fast.) So the local affect of even a linear sea level rise could be very bad for society.
Hahahahaaaaa.... all bow down to Master Ding, the King of the Board!
Hahahahaaaaa.... all bow down to Master Ding, the King of the Board!
King of you anyway....pleasure to watch.
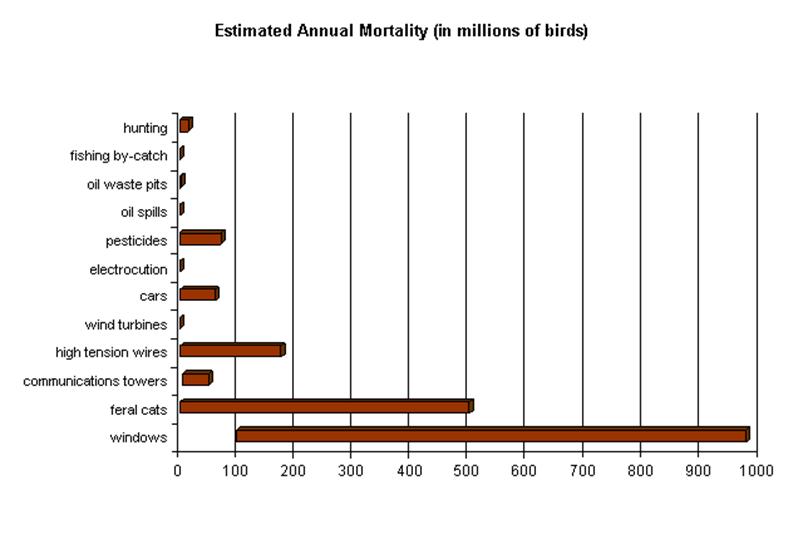
Funny, I assumed that you could read. See the two listed "Oil waste pits" and "Oil spill"? Looks like those take a least double what the windmills do.OK.Wind turbines kill up to 39 million birds a year!
- Home
- >>
- Renewable Energy
- >>
- Wind farms in Texas, N.D., N.Y. move forward
Wind farms in Texas, N.D., N.Y. move forward
08/29/2016
By Barry Cassell
Chief Analyst, TransmissionHub

August saw development steps for several wind projects around the United States, including two companion projects (149 MW apiece) in North Dakota of NextEra Energy.
Project highlights during the month, as reported by GenerationHub, included:
Brady Interconnection on Aug. 25 filed with the Federal Energy Regulatory Commission a shared facilities agreement between Brady Interconnection, Brady Wind and Brady Wind II. Brady Wind and Brady Wind II are each developing wind power facilities of about 149 MW. Brady Wind and Brady Wind II each have an application for market-based rates pending in front of the commission.
They are part of NextEra Energy Resources, a unit of NextEra Energy. Brady Interconnection will own an about 19-mile, 230 kV generation tie line serving the Brady Wind and Brady Wind II projects in Stark County, North Dakota. The point of interconnection is at the Daglum Substation owned by Basin Electric Power Cooperative. The Brady Wind facility may start producing test energy as early as Oct. 25, 2016. The Brady Wind II facility may start producing test energy as early as Nov. 15, 2016.
Filed with the Texas Public Utility Commission were interconnect deals for two wind projects of Lincoln Clean Energy that would have staggered commercial operation dates but the same interconnection point. Oncor Electric Delivery Co. filed with the commission on Aug. 19 a Standard Generation Interconnection Agreement with Dermott Wind for a 253 MW project that is due in commercial operation on Aug. 30, 2017. The project's Point of Interconnection is in Scurry County, Texas, at the Dermott Switching Station.
This project to be made up of 110 General Electric wind turbines sized at 2.3 MW each. Oncor filed at the commission a similar agreement with Coyote Wind for a project that is due in commercial operation on Aug. 30, 2018. The agreement covers a 242.5 MW wind farm that will be composed of 97 GE wind turbines of 2.5 MW each. The project's Point of Interconnection will also be at the Dermott Switching Station.
FERC approved the filing by the New York Independent System Operator and interconnecting transmission owner the New York Power Authority of an executed Large Generator Interconnection Agreement for the in-construction, 77.7 MW project of Jericho Rise Wind Farm. This wind farm is in Franklin County, New York. It will consist of 37 Gamesa G114 2.1 MW turbines.
The project will interconnect to transmission facilities of NYPA at the existing 115 kV Willis Substation. The project's commercial operation target date under this LGIA is in November of this year. A listed project contact is with EDP Renewables North America.
The U.S. Bureau of Ocean Energy Management announced in the Aug. 18 Federal Register that it has gotten an unsolicited application for wind area leasing from Trident Winds for a 765 MW wind project to be located offshore of the retired Morro Bay power plant in California. The bureau will now seek any competing offers for the tract.
http://www.elp.com/articles/2016/08/wind-farms-in-texas-n-d-n-y-move-forward.html
As grid level storage comes online, the wind farms will be increasingly lucrative investments. Trump, or no Trump.
Federal officials investigate eagle deaths at DWP wind farm
http://savetheeaglesinternational.o...10-20-times-more-than-previously-thought.html
Wind turbines killing more than just local birds, study finds - Purdue University
License to Kill: Wind and Solar Decimate Birds and Bats - IER
Windmills Are Killing Our Birds
A chart showing estimated numbers of birds killed annually by each of several different causes. Data from various sources.
Causes of Bird Mortality - Sibley Guides
OK, let's kill all the house cats, and shutter all windows. Egad, you people are stupid.
Funny how I don't see coal or oil listed.
OK, don't yap, show us. That is what really turns me off on a poster, regardless of which side he or she is on. Stating "I can show you", then failing to do so.Would you like for me to show you what the relationship is between atmospheric CO2 and CO2 emissions? If you like I can give you the equation.We know from historic levels of sea level rise from 26k to around 6k ago that abrupt and severe sea level change is very possible. I posted pretty much the same graph.
We're seeing sea level rise that we haven't seen since that period....As our planet warms the ice is going to melt.
Rather the contrary. In the period that the sea level rose to the present level, thousands of years, the level of CO2 rose from 180 ppm to 280 ppm. And the CO2 also rose at a slow pace. Today, in a bit over 150 years, we have raised the CO2 from 280 ppm to over 400 ppm. It is very possible that we will see some decadal sea level rises of several feet. Past records do not show a nice linear rise in sea level. Rather, in periods of rapid rise, there were periods of relative stability, then rapid rise.You are comparing apples to oranges. Those sea level changes were glacial to interglacial changes. We are in an interglacial cycle. So expecting to see a similar change now is illogical, irrational and ignorant.We know from historic levels of sea level rise from 26k to around 6k ago that abrupt and severe sea level change is very possible. I posted pretty much the same graph.
We're seeing sea level rise that we haven't seen since that period....As our planet warms the ice is going to melt.
Why?Forecasts are not credible because of who creates the forecast. Forecasts are credible because they represent historical data accurately and honor existing well established existing trends. There is a well established trend that exists today. This trend is based upon increasing CO2 emissions. Do you know which of the IPPC curves represents the historic, increasing CO2 emissions?Those are some really fancy graphs. Very impressive graphics, I can see why you accept their findings. Just one thing though... why do you believe emission scenario A1 and A2 are credible?No. I don't. I suspect you are both too scared to have your flaws exposed. I'm happy enough for you both to ignore these simple questions to prove my point.You need to spend some time going over the last few thousand posts. You've been spouting information as if you were talking to the great unwashed when virtually every iota you've brought up here was talked to death YEARS back. Try listening just a little bit more. Can't hurt.
Would you like to tell me what you believe atmospheric CO2 will be by the year 2100?
No. I suspect it will fall in somewhere within the IPCC projections, tending (IMHO) between the A1 and A2 scenarios

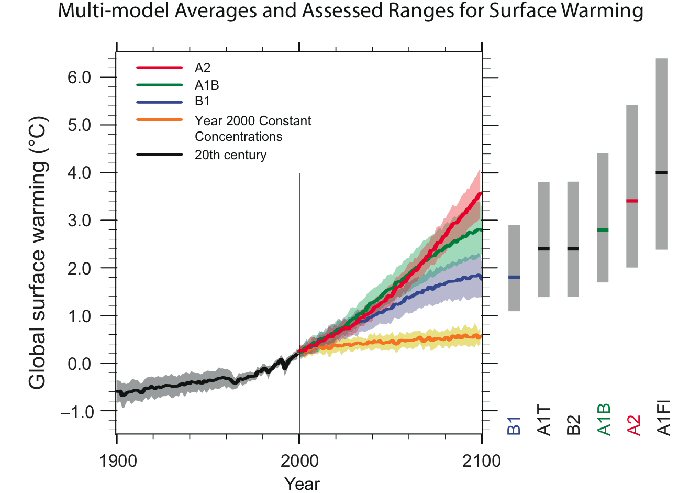


Emissions Scenarios
Credible? Because they have been developed over the past several decades by actual experts in the associated fields. And I believe we will end up with the higher of the various scenarios because my experience and the lessons of history tell us that humans are pretty stupid about committing long term to efforts with little visible, short term gains.
Do you not believe they are credible?
No... I do not believe they are not credible... or to say it without the triple negative... I do not believe that A1 and A2 are credible forecast of CO2 emissions. Therefore, I do not believe that A1 and A2 are credible atmospheric CO2 projections.
I do believe that B2 is a credible CO2 emission and atmospheric CO2 forecast that matches the existing CO2 emission and atmospheric CO2 data.
The Supermoon and Global Warming: A Taste of Things to Come
The Supermoon, Global Warming, and Flooding: A Taste of Things to Come
There is one real thing about the “Supermoon”: It causes flooding. But it needs help in the form of global warming.
I wrote about the so-called “Supermoon” on Monday. The basic idea is that we get a “Suupermoon” when the Moon is full at the same time it’s also at its closest point to Earth in its orbit. According to the lore, the Moon will look bigger and be brighter.
While technically true, these claims tend to be overhyped and breathless, leaving people thinking they’ll see a ginormous Moon in the sky. That’s not the case; as I point out in the article earlier this week the “Supermoon” is only about 10 percent closer than it is when it’s at apogee (the farthest point in its orbit from Earth). You’d never notice the difference in size unless you measure it. It does get brighter, by about 20 - 30 percent, which again is tough to notice on your own.
But there is one thing I didn’t mention in that article, and this is a very real and potentially disastrous effect: Tides.
The Rising Seas
If things were normal, that would be bad enough. Coastal areas prone to flooding see higher tides twice a month due to spring tides, and also higher tides once a month from the proxigean tides. When they line up it’s worse, but generally not catastrophic.
…nature itself will amplify it more and more, year by year. Global warming is making that inevitable.
Unless, that is, a third force comes along. For example, if this happens when there’s a storm, off shore, things can get very bad. Low-pressure systems (like hurricanes or just big storms) draw water toward their centers. If one comes ashore, this can create a storm surge, inundating low-lying areas.
But there’s yet another factor here, and it’s the most pernicious of all: sea level rise.
Global warming is melting ice at the poles (yes, at both poles), and also causing water in the oceans to expand. This is causing the sea levels to rise up over time, by about three millimeters per year. That may not sound like much, but it adds up, year after year. It’s risen 85 mm — over three inches — just since 1993!
Sea level rise measured by satellite since 1993.
NASA / Goddard Space Flight Center
As Tamino points out at the Open Mind blog, this alone is enough to cause flooding in coastal areas like Miami and Boston during a normal high tide.
Proxigean tides aren’t normal; they are extra strong. That’s why the NOAA issued a coastal flood warning not just for Monday but for this whole week up until tonight. It’s not until then that the Moon moves away enough both from the Earth and the Earth/Sun line to weaken tides sufficiently to relent on flooding.
But there was flooding, in Portland, Maine, Charleston, South Carolina, and many other locations. From what I can find it was bad but not devastating. It’s what Tamino calls nuisance flooding, and — pardon the expression — it’s on the rise.
In other words, and to be very clear: Global warming is causing sea level rise, which is causing more flooding all the time, and it will get worse. A lot worse.
Adding a bunch of good science today and news.
Sure, but first maybe you could humor me by telling me what you believe atmospheric CO2 will be by the year 2100. Fair enough?OK, don't yap, show us. That is what really turns me off on a poster, regardless of which side he or she is on. Stating "I can show you", then failing to do so.Would you like for me to show you what the relationship is between atmospheric CO2 and CO2 emissions? If you like I can give you the equation.We know from historic levels of sea level rise from 26k to around 6k ago that abrupt and severe sea level change is very possible. I posted pretty much the same graph.
We're seeing sea level rise that we haven't seen since that period....As our planet warms the ice is going to melt.
No. That's not possible. I don't believe you understand the glacial-interglacial cycles as it pertains to CO2 levels and associated temperature.Rather the contrary. In the period that the sea level rose to the present level, thousands of years, the level of CO2 rose from 180 ppm to 280 ppm. And the CO2 also rose at a slow pace. Today, in a bit over 150 years, we have raised the CO2 from 280 ppm to over 400 ppm. It is very possible that we will see some decadal sea level rises of several feet. Past records do not show a nice linear rise in sea level. Rather, in periods of rapid rise, there were periods of relative stability, then rapid rise.You are comparing apples to oranges. Those sea level changes were glacial to interglacial changes. We are in an interglacial cycle. So expecting to see a similar change now is illogical, irrational and ignorant.We know from historic levels of sea level rise from 26k to around 6k ago that abrupt and severe sea level change is very possible. I posted pretty much the same graph.
We're seeing sea level rise that we haven't seen since that period....As our planet warms the ice is going to melt.
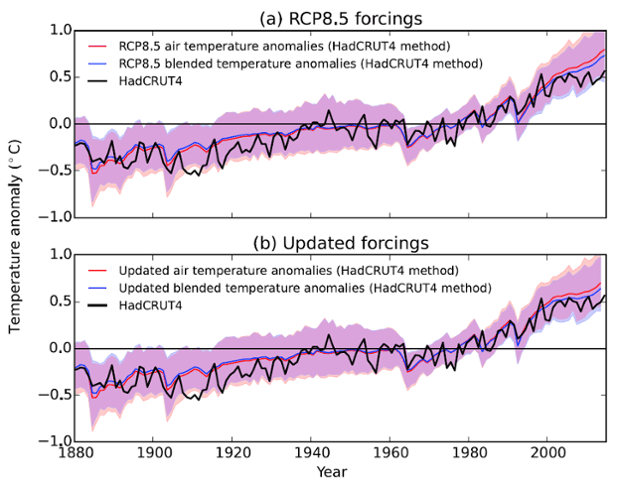
Because if you cross plot the atmospheric CO2 against CO2 emissions, you get a linear relationship which means the more we emit the more that is absorbed by natural carbon sinks. So the only way you can get an exponential change in atmospheric CO2 is to have an exponential growth in carbon emissions which is unlikely and does not match historic trends.Why?Forecasts are not credible because of who creates the forecast. Forecasts are credible because they represent historical data accurately and honor existing well established existing trends. There is a well established trend that exists today. This trend is based upon increasing CO2 emissions. Do you know which of the IPPC curves represents the historic, increasing CO2 emissions?Those are some really fancy graphs. Very impressive graphics, I can see why you accept their findings. Just one thing though... why do you believe emission scenario A1 and A2 are credible?No. I don't. I suspect you are both too scared to have your flaws exposed. I'm happy enough for you both to ignore these simple questions to prove my point.
Would you like to tell me what you believe atmospheric CO2 will be by the year 2100?
No. I suspect it will fall in somewhere within the IPCC projections, tending (IMHO) between the A1 and A2 scenarios
Emissions Scenarios
Credible? Because they have been developed over the past several decades by actual experts in the associated fields. And I believe we will end up with the higher of the various scenarios because my experience and the lessons of history tell us that humans are pretty stupid about committing long term to efforts with little visible, short term gains.
Do you not believe they are credible?
No... I do not believe they are not credible... or to say it without the triple negative... I do not believe that A1 and A2 are credible forecast of CO2 emissions. Therefore, I do not believe that A1 and A2 are credible atmospheric CO2 projections.
I do believe that B2 is a credible CO2 emission and atmospheric CO2 forecast that matches the existing CO2 emission and atmospheric CO2 data.
Wow now they have it down not just to a mm but to a 1/10th of a mm. This is getting ever more ridiculous. The best satellites have ephemeris variations of 30 to 40 mm but somehow the AGW apostles manage to convince a dumbed down population segment which now wears diaper pins that they can detect a 3.4 mm sea level rise. NASA has the orbital variations of the satellites they use at 40 to 50 mmUniversity of Colorado says it is rising currently at 3.4 mm/year
CU Sea Level Research Group | University of Colorado
3.4 x 83 =282.2 mm or 11.1 inches.
Those are some really fancy graphs. Very impressive graphics, I can see why you accept their findings. Just one thing though... why do you believe emission scenario A1 and A2 are credible?No. I don't. I suspect you are both too scared to have your flaws exposed. I'm happy enough for you both to ignore these simple questions to prove my point.You need to spend some time going over the last few thousand posts. You've been spouting information as if you were talking to the great unwashed when virtually every iota you've brought up here was talked to death YEARS back. Try listening just a little bit more. Can't hurt.
Would you like to tell me what you believe atmospheric CO2 will be by the year 2100?
No. I suspect it will fall in somewhere within the IPCC projections, tending (IMHO) between the A1 and A2 scenarios
Emissions Scenarios
What is your point?


and there is

How does it do that?That GCM performance has been far superior to what "Pat Frank's Devasating Expose of Climate Model Error" might lead one to believe.
Right, so how does is GCM's performance measured? It's just a model, right?How does what do what?
GCM = general climate model, intrinsically plural.