Saigon
Gold Member
I thought it might be good to have a thread where those who do not believe humans play a role in climate change could present their science.
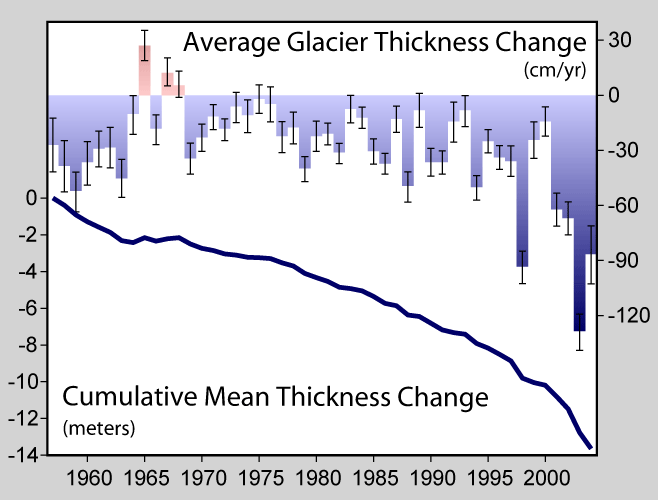
Much of the debate here seems political to me, which at the end of the day does not prove anything. We know polar ice is melting, we know glacier are retreating - what I want to know is why, and what will happen next.
Please leave the politics to one side here, and stick to strong scientific reasoning.