The science against climate change

You are conflating two. Problems. Bad siting and a meat grinder set of adjustments that spit out warming trends regardless of the input.. Both are important and relevant

They were problems back in the 1970s, definitely.

But these days there are enough measuring stations and science units accessing the data from them that we are able to discount any compromised stations or research units and go with the others.

I've met the people here in Finland who work in this field and have been ery impressed by their credentials and lack of interest in politics!

I haven't seen compelling evidence to suggest warming has not been occuring steadily for the past 150 years , have you?
 
None of it matters.

Less pollution is better. Period.

Pollution has almost NO significance in Global Warming. CO2 does.. But CO2 is not a pollutant in scientific terms. Only in warped legal-political terms..

The effort to EQUATE CO2 with pollution is indicative of how far astray the warmers will go to force their views on energy and Earth's Salvation on the rest of us.. Not YOU of course, just the EPA and the politicians.. :cool:
 
Flac -

I'm very keen to stay away from the politics on this thread, as we're never going to agree on that.

But if CO2 is NOT a factor in rising global temperatures and artic melt - what is?
 
You are conflating two. Problems. Bad siting and a meat grinder set of adjustments that spit out warming trends regardless of the input.. Both are important and relevant

They were problems back in the 1970s, definitely.

But these days there are enough measuring stations and science units accessing the data from them that we are able to discount any compromised stations or research units and go with the others.

I've met the people here in Finland who work in this field and have been ery impressed by their credentials and lack of interest in politics!

I haven't seen compelling evidence to suggest warming has not been occuring steadily for the past 150 years , have you?

Which do you prefer? ONE SENSOR on a satellite or 20,000 stations randomly spaced around the globe? Warmer scientists want to concentrate on the 20,000 earth-based stations. Why? Because they can "massage" the data..

It is extremely easy to find artifacts induced into the surface record by fiddling by comparing to satellite data. I'll show you -- if you're TRULY interested. Which I doubt from past dialogues with you.

Don't care about the surface temp record really. The earth is warming.. We move on from there to answer questions about WHY that's happening. And CO2 is a poor excuse for the entire answer. In fact, it's a poor answer.

Ian's already told you that those Ice Melt rates were likely higher in the 30's and 40s BEFORE the CO2 started to climb. Just that one observation should give you pause to ponder. Melt rates are REALLY HIGH when you come out of a Ice Age.. You got a REALLY HIGH C02 observation to go with that? No -- you don't....
 
Ian's already told you that those Ice Melt rates were likely higher in the 30's and 40s BEFORE the CO2 started to climb.

Ian produced evidence from a single glacial area in Alaska.

If you go back to a post early in this thread you'll see I linked a chart showing glaciers around the world dating back a thouand years or so.

The warming from the 1850s was not global.
 
Flac -

I'm very keen to stay away from the politics on this thread, as we're never going to agree on that.

But if CO2 is NOT a factor in rising global temperatures and artic melt - what is?

Look Shill --- I was only FIXING the common misconception that POLLUTION is LINKED to Global Warming.. Nothing more than that.

I'm dubious about having any kind of discussion with you after that whine fest about Grapes being plowed under in Australia. I've wasted too much time already trying to track down YOUR VERSION of the truth...
 
And CO2 is a poor excuse for the entire answer. In fact, it's a poor answer.

Ok - then what IS the answer?

We have the evidence - from increasing droughts and cyclones to melting poles to changing ocean pH - what is the cause?
 
Ian's already told you that those Ice Melt rates were likely higher in the 30's and 40s BEFORE the CO2 started to climb.

Ian produced evidence from a single glacial area in Alaska.

If you go back to a post early in this thread you'll see I linked a chart showing glaciers around the world dating back a thouand years or so.

The warming from the 1850s was not global.

Now see.. Here's where you go off the rails with "The warming from the 1850s was not global"... Neither was your GREAT GRAPE DIEOFF GLOBAL jerk-off, but yu still managed to blame THAT on Global Warming.. How damn convienient and unscientifically hypocrital is that?
 
... Neither was your GREAT GRAPE DIEOFF GLOBAL jerk-off, but yu still managed to blame THAT on Global Warming.. How damn convienient and unscientifically hypocrital is that?

To take the grape issue first:

What was proven on the previous thread was that:

- droughts have hit the Australian NSW wine industry 12 times in the past 15 years or so

- in 2008 droughts were so severe that some farmers in NSW stopped farming grapes

- the total land area devoted to grape farming fell every year from 2008 onwards

- local farmers and scientists both link the change in drought patterns with climate change.

To get back to the topic:

Current melting of glaciers is global. Some 97% of the worlds glaciers are in retreat.

Previous melting periods - such as the 1850s - were more regional in nature.

How do you explain the current melting?
 
You are conflating two. Problems. Bad siting and a meat grinder set of adjustments that spit out warming trends regardless of the input.. Both are important and relevant

They were problems back in the 1970s, definitely.

But these days there are enough measuring stations and science units accessing the data from them that we are able to discount any compromised stations or research units and go with the others.

I've met the people here in Finland who work in this field and have been ery impressed by their credentials and lack of interest in politics!

I haven't seen compelling evidence to suggest warming has not been occuring steadily for the past 150 years , have you?
Weather Stations Disappearing Worldwide | Watts Up With That?
Amazing as this sounds, weather stations used to monitor near surface temperature for the global climate record are disappearing worldwide at and alarming rate. There are two things going on here: 1) Stations are actually being closed down, particularly in Canada and in Russia in the early 1990′s. 2) Some stations while open, have disappeared off the reporting radar for global temperature metrics such as GISS.

--

In response to that, Steve McIntyre recently found that a number of stations that went missing from the NASA GISTEMP dataset are still actually in operation, and producing data, are not being updated into the GISTEMP dataset for some reason. Irregardless of the reason, the problem of dwindling data for the ROW as demonstrated by the video above is real.

What is strange though is that some obviously easy to locate data, (link to data) such as Bern, Switzerland, where the headquarters of the World Meteorological Organization (WMO) are located, are missing from NASA GISTEMP. Nearby stations such as Zurich, Switzerland are included in the GISTEMP database.

Other stations, such as Crater Lake, OR, are removed from the GISS source code released last year, with a citation saying they are excluded (but exist online in GISTEMP), but no reason is given. yet other stations like this terrible rooftop station cum heat anomaly (and closed by NWS for that reason) in Baltimore, MD are included.​

The number of stations has decreased: Historical Station Distribution « Climate Audit

And the data from the remaining stations is cherry-picked:
Climategate goes SERIAL: now the Russians confirm that UK climate scientists manipulated data to exaggerate global warming – Telegraph Blogs
Climategate has already affected Russia. On Tuesday, the Moscow-based Institute of Economic Analysis (IEA) issued a report claiming that the Hadley Center for Climate Change based at the headquarters of the British Meteorological Office in Exeter (Devon, England) had probably tampered with Russian-climate data.
The IEA believes that Russian meteorological-station data did not substantiate the anthropogenic global-warming theory. Analysts say Russian meteorological stations cover most of the country's territory, and that the Hadley Center had used data submitted by only 25% of such stations in its reports. Over 40% of Russian territory was not included in global-temperature calculations for some other reasons, rather than the lack of meteorological stations and observations.
The data of stations located in areas not listed in the Hadley Climate Research Unit Temperature UK (HadCRUT) survey often does not show any substantial warming in the late 20th century and the early 21st century.
The HadCRUT database includes specific stations providing incomplete data and highlighting the global-warming process, rather than stations facilitating uninterrupted observations.
On the whole, climatologists use the incomplete findings of meteorological stations far more often than those providing complete observations.
IEA analysts say climatologists use the data of stations located in large populated centers that are influenced by the urban-warming effect more frequently than the correct data of remote stations.​

NASA and NOAA cherry-picking Canadian weather stations (but it could have been much worse!)
Perhaps the key point discovered by Smith was that by 1990, NOAA had deleted from its datasets all but 1,500 of the 6,000 thermometers in service around the globe.
These are the same datasets, incidentally, which serve as primary sources of temperature data not only for climate researchers and universities worldwide, but also for the many international agencies using the data to create analytical temperature anomaly maps and charts.
It seems that stations placed in historically cooler, rural areas of higher latitude and elevation were scrapped from the data series in favor of more urban locales at lower latitudes and elevations. Consequently, post-1990 readings have been biased to the warm side not only by selective geographic location, but also by the anthropogenic heating influence of a phenomenon known as the Urban Heat Island Effect (UHI).
For example, Canada's reporting stations dropped from 496 in 1989 to 44 in 1991, with the percentage of stations at lower elevations tripling while the numbers of those at higher elevations dropped to one. That's right: As Smith wrote in his blog, they left "one thermometer for everything north of LAT 65." And that one resides in a place called Eureka, which has been described as "The Garden Spot of the Arctic" due to its unusually moderate summers.

--

Not just Canadian data, but data sets everywhere were torqued so that cold data simply melted away, or so say these researchers.

For instance, Hawaiian data (taken on hot airport tarmacs, of course) was used as stand-in data for cooler ocean waters 1200km away.​

You ask skeptics to provide science? We don't have to. It's up to AGW supporters to provide good science to back up their claims.

They've provided science -- but not good science.
 
... Neither was your GREAT GRAPE DIEOFF GLOBAL jerk-off, but yu still managed to blame THAT on Global Warming.. How damn convienient and unscientifically hypocrital is that?

To take the grape issue first:

What was proven on the previous thread was that:

- droughts have hit the Australian NSW wine industry 12 times in the past 15 years or so

- in 2008 droughts were so severe that some farmers in NSW stopped farming grapes

- the total land area devoted to grape farming fell every year from 2008 onwards

- local farmers and scientists both link the change in drought patterns with climate change.

To get back to the topic:

Current melting of glaciers is global. Some 97% of the worlds glaciers are in retreat.

Previous melting periods - such as the 1850s - were more regional in nature.

How do you explain the current melting?

You presented NO NONE NADA evidence that the wine grape YIELD in Australia has suffered. Because there IS NONE... But you presented an amazing case of stubborn refusal to address the FACTS in front of you... It doesn't rain in NAPA and SONOMA for 6 months out of the year and their grapes are WORLD RENOWNED.. Get over it... You got crushed.

Bullshit about crap being REGIONAL.. According to the IPCC the Med. Warm Period was regional when a preponderous OF GOOD EVIDENCE contradicts that. You'll find that ANYTIME the warmers are face with a logical dissonance they will declare that "it's not GLOBAL", but anytime a LOCAL EVENT happens -- THAT'S AGWarming.

And before I answer any more of YOUR QUESTIONS, why don't you address ANY of the questions I've given you? Like where is the CO2 LINKAGE for ending the last Ice Age or ANY of the last 4 ICE AGES?? Eh? And the MELT RATE for ice was EXTRADORINARLY HIGH in the 30s and 40s -- very well documented. Where was the lethal amount of CO2? Eh?
I need you to answer those first and then we can discuss the REASON the glaciers are retreating since the Dark Ages. And WHY there was accerelated melting back in recent history. Which is that someone turned up the thermostat on the sun and LEFT IT THERE for several HUNDRED years..

flacaltenn-albums-charts-picture4620-tim-tsi-reconstruction-2012.jpg
 
Saigon::

You also never commented on my satellite vs ground station question to you or showed any interest in SEEING warmer induced artifacts in the ground record..

Sooo --- this is not really a conversation is it? More like an Inquisition by clowns... Think I'll just take a raincheck...
 
CO2 lags climate.

Always did

Always will

There not a single lab experiment that shows how even a 200PPM increase in CO2 can raise temperature.

Let it go, Warmers
 
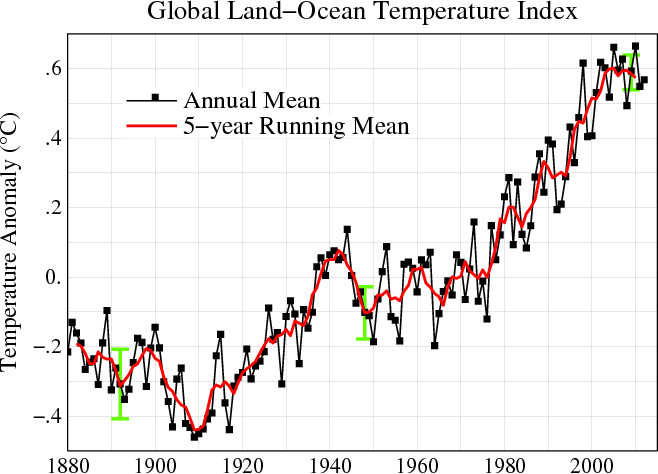
I agree, and of course this is not an easy thing to measure accurately. There is a subjective element to this at the moment, although hopefully we will see clearer patterns emerging as time passes.

But I call this pattern alarming:

Global_Temperature_Anomaly_1880-2010_%28Fig.A%29.gif


If it is not caused by CO2 - what is it?

Is this really part of a normal cycle that happens to coincide with a rise in the concentration of atmospheric CO2?

there have been dozens of threads about the actual measuring of global temperatures. much of the increase is simply 'adjustments' to the raw data, and changes to the weightings of individual areas. I really dont want to rehash the same points over and over again. global temperature is almost a useless concept except to create fear by massively overstating the precision and accuracy of the readings , and hiding the methodologies of the adjustments.
Yeah, you don't want to rehash your bullshit, you just want to restate it unchallenged!

How many times have we heard the deniers bitch about measuring stations being located near heat sources and that they should be removed and the data stricken and adjusted without them. Then when the stations are removed and the data adjusted these same deniers bitch about fewer stations and adjusted data. These morons, who have no understanding of how anomalies work, expected the temps to go down when data from stations near heat sources was removed and then cried foul when the temps rose with the more accurate data.

Anomalies are measured against a 30 year average and if the station is near a heat source the 30 year average measuring stick will be higher giving lower current readings. Removing these false lows, as the deniers demanded, gives higher and more accurate warming trends, but the deniers never wanted more accurate data so they whine and cry like little babies that the more accurate data that they demanded is fudged because it was adjusted according to their demands! :cuckoo:

Really, Truely, didn't happen that way.. The observation was the parking lots, asphalt and air conditioners had encroached on already sited stations over those 30 years. Which caused a differential trend in those readings. And when the lead author of BEST validated that complaint -- he then proceeded to process the data without tackling the task of sorting all that out.. In fact, most of data preps for surface temp readings still ignore Urban Heating Island effects and hand wave the justifications for doing so. When CLEARLY, any idiot can see that urban/suburban readings are different and biased.

Doesn't matter. Because the whole concept of measuring 0.1degC change in surface temperature by averaging spotty and irregular surface temp measurements from 20,000 thermometers all over the globe is obsolete. and I will prefer to believe the satellite data or REGIONAL preps of the surface stations.

A SINGLE averaged number like that --- doesn't really describe Global Climate Change very well anyway.. And that's a fact..
Of course nothing you posted is true!

Richard Muller on BEST, skeptics, the Urban Heat Island and future plans - transcript | Carbon Brief

There were issues about station quality - Anthony Watts had shown that many of the stations had poor quality. We had studied that in great detail. Fortunately, we discovered that station quality did not affect the results. Even poor stations reflect temperature changes accurately.

Two more things. The urban heat island effect. That was something we studied I think in a clever and original way. [As opposed to] using all the stations, we could derive the temperature rise based only on rural stations. We got the same answer.

Of course you get the same rise.. I'm truly not impressed by that. I could probably mount a thermometer on the outside of my oven and know that the temp is rising inside. But that doesn't mean that when you COMBINE those biased readings you get the correct AVERAGE. And its from the summation of all those readings that you are trying discern a fractional degree all over the globe.

Your revelation that you get the same RISE doesn't really impress me if you're gonna try to average all those readings LEAVING IN a known bias.. Which is exactly the cop-out that Muller took after realizing what a job it would be to actually FIX the bias in the data.

His excuse that both urban/rural readings show the same rise isn't even correct. Because it's largely dependent on population density and growth rate. Something that the folks at UAH have corrected using population density adjustments. And guess what? THEIR DATA prep matches the SATELLITE observations MUCH MORE CLOSELY than any of the sloppily assembled data preps from folks who IGNORE UHIsland effects...
 
Two more things. The urban heat island effect. That was something we studied I think in a clever and original way. [As opposed to] using all the stations, we could derive the temperature rise based only on rural stations. We got the same answer.

Of course you did. The models were built to provide a rise no matter what data was input. You could have entered all the phone numbers for the 506 area code and gotten a temperature rise.
 
Really, Truely, didn't happen that way.. The observation was the parking lots, asphalt and air conditioners had encroached on already sited stations over those 30 years. Which caused a differential trend in those readings. And when the lead author of BEST validated that complaint -- he then proceeded to process the data without tackling the task of sorting all that out.. In fact, most of data preps for surface temp readings still ignore Urban Heating Island effects and hand wave the justifications for doing so. When CLEARLY, any idiot can see that urban/suburban readings are different and biased.

Doesn't matter. Because the whole concept of measuring 0.1degC change in surface temperature by averaging spotty and irregular surface temp measurements from 20,000 thermometers all over the globe is obsolete. and I will prefer to believe the satellite data or REGIONAL preps of the surface stations.

A SINGLE averaged number like that --- doesn't really describe Global Climate Change very well anyway.. And that's a fact..
Of course nothing you posted is true!

Richard Muller on BEST, skeptics, the Urban Heat Island and future plans - transcript | Carbon Brief

There were issues about station quality - Anthony Watts had shown that many of the stations had poor quality. We had studied that in great detail. Fortunately, we discovered that station quality did not affect the results. Even poor stations reflect temperature changes accurately.

Two more things. The urban heat island effect. That was something we studied I think in a clever and original way. [As opposed to] using all the stations, we could derive the temperature rise based only on rural stations. We got the same answer.

Of course you get the same rise.. I'm truly not impressed by that. I could probably mount a thermometer on the outside of my oven and know that the temp is rising inside. But that doesn't mean that when you COMBINE those biased readings you get the correct AVERAGE. And its from the summation of all those readings that you are trying discern a fractional degree all over the globe.

Your revelation that you get the same RISE doesn't really impress me if you're gonna try to average all those readings LEAVING IN a known bias.. Which is exactly the cop-out that Muller took after realizing what a job it would be to actually FIX the bias in the data.

His excuse that both urban/rural readings show the same rise isn't even correct. Because it's largely dependent on population density and growth rate. Something that the folks at UAH have corrected using population density adjustments. And guess what? THEIR DATA prep matches the SATELLITE observations MUCH MORE CLOSELY than any of the sloppily assembled data preps from folks who IGNORE UHIsland effects...
You got caught lying and you think that makes you credible!

UAH have already been caught fudging the data, no wonder you like their data.

Lying about what? I said that Muller ACKNOWLEDGED the bias in the surface data and then waved his hands to ignore doing the work to remove it.. You're the one that doesn't understand the diff between Muller's statement of "DERIVING the rise in temp." from biased data and promulgating that bias into an averaged data set...

UAH hasn't fudged ANYTHING with the surface data. Their US data prep does match closer to satellite observations BECAUSE they rationally correct for urbanization. To see how badly Muller is covering his ass --- go to NOAA and see what they've done to justify UPPING the temperatures for UHI effect. THEY don't agree it doesn't exist. Wanna argue with them? They've used that as a further excuse to muck incessantly with the datasets.
 
Last edited:
Yeah, you don't want to rehash your bullshit, you just want to restate it unchallenged!

How many times have we heard the deniers bitch about measuring stations being located near heat sources and that they should be removed and the data stricken and adjusted without them. Then when the stations are removed and the data adjusted these same deniers bitch about fewer stations and adjusted data. These morons, who have no understanding of how anomalies work, expected the temps to go down when data from stations near heat sources was removed and then cried foul when the temps rose with the more accurate data.

Anomalies are measured against a 30 year average and if the station is near a heat source the 30 year average measuring stick will be higher giving lower current readings. Removing these false lows, as the deniers demanded, gives higher and more accurate warming trends, but the deniers never wanted more accurate data so they whine and cry like little babies that the more accurate data that they demanded is fudged because it was adjusted according to their demands! :cuckoo:

Really, Truely, didn't happen that way.. The observation was the parking lots, asphalt and air conditioners had encroached on already sited stations over those 30 years. Which caused a differential trend in those readings. And when the lead author of BEST validated that complaint -- he then proceeded to process the data without tackling the task of sorting all that out.. In fact, most of data preps for surface temp readings still ignore Urban Heating Island effects and hand wave the justifications for doing so. When CLEARLY, any idiot can see that urban/suburban readings are different and biased.

Doesn't matter. Because the whole concept of measuring 0.1degC change in surface temperature by averaging spotty and irregular surface temp measurements from 20,000 thermometers all over the globe is obsolete. and I will prefer to believe the satellite data or REGIONAL preps of the surface stations.

A SINGLE averaged number like that --- doesn't really describe Global Climate Change very well anyway.. And that's a fact..
Of course nothing you posted is true!

Richard Muller on BEST, skeptics, the Urban Heat Island and future plans - transcript | Carbon Brief

There were issues about station quality - Anthony Watts had shown that many of the stations had poor quality. We had studied that in great detail. Fortunately, we discovered that station quality did not affect the results. Even poor stations reflect temperature changes accurately.

Two more things. The urban heat island effect. That was something we studied I think in a clever and original way. [As opposed to] using all the stations, we could derive the temperature rise based only on rural stations. We got the same answer.

Of course you get the same rise.. I'm truly not impressed by that. I could probably mount a thermometer on the outside of my oven and know that the temp is rising inside. But that doesn't mean that when you COMBINE those biased readings you get the correct AVERAGE. And its from the summation of all those readings that you are trying discern a fractional degree all over the globe.

Your revelation that you get the same RISE doesn't really impress me if you're gonna try to average all those readings LEAVING IN a known bias.. Which is exactly the cop-out that Muller took after realizing what a job it would be to actually FIX the bias in the data.

His excuse that both urban/rural readings show the same rise isn't even correct. Because it's largely dependent on population density and growth rate. Something that the folks at UAH have corrected using population density adjustments. And guess what? THEIR DATA prep matches the SATELLITE observations MUCH MORE CLOSELY than any of the sloppily assembled data preps from folks who IGNORE UHIsland effects...
You got caught lying and you think that makes you credible!

UAH have already been caught fudging the data, no wonder you like their data.

Lying about what? I said that Muller ACKNOWLEDGED the bias in the surface data and then waved his hands to ignore doing the work to remove it.. You're the one that doesn't understand the diff between Muller's statement of "DERIVING the rise in temp." from biased data and promulgating that bias into an averaged data set...

UAH hasn't fudged ANYTHING with the surface data. Their US data prep does match closer to satellite observations BECAUSE they rationally correct for urbanization. To see how badly Muller is covering his ass --- go to NOAA and see what they've done to justify UPPING the temperatures for UHI effect. THEY don't agree it doesn't exist. Wanna argue with them? They've used that as a further excuse to muck incessantly with the datasets.
The dumb act!

And UAH got caught using the opposite sign to correct for diurnal satellite drift turning global warming into global cooling.
 
Last edited:

Forum List

Back
Top