
- Banned
- #81
My pol is what ALL AMERICANS say they are,
Where is theto this poll of yours that states that 70% of Americans call themselves conservatives.
Looks like the little nimrod disappeared , I wonder why
Follow along with the video below to see how to install our site as a web app on your home screen.

Note: This feature currently requires accessing the site using the built-in Safari browser.
My pol is what ALL AMERICANS say they are,
Where is the
According to the math, Kerry should have won in '04. Polls don't mean shit. Do you know why? Because nobody answers honestly. Not only that, when certain folks, the folks that matter are polled, the ones that actually vote, they don't like to participate or interact with social scientists. On top of that, the different polling companies have different agendas and different sampling methods.LOLUhm, no.
And Charlie Cook is anything but a Leftie.
Try again.
I'm so glad you are concerned for the GOP............It's moving................

You misunderstand.
It's not concern.
It's math.
Now, wake up and look at the math for yourself and decide whether or not the GOP should fucking stop hating on brown people before it is too late.
I can tell you right now, that the folks on this site most likely to vote, the conservatives on this site, are the ones most likely to hang up on a pollster. The towns in my state that have large Hispanic and Arabic populations that have conservatives in them, those conservatives act the same way. What does that tell you about the accuracy of these polls?
I took statistical analytics classes at University for my poli-sci major. I know what these polls mean. These polls are a waste of time. They are there to manipulate and brain wash the masses only. The exit polls tell the truth. The truth rarely matches up with reality skipper.
The only people here that care about your cognitive bias are the partisans that need to have their own reality reinforced. You better hope that what you are posting is reinforced with a win for your candidate, or you will have no currency at this site any longer. Seriously.
The establishment and the power brokers are the ones that decide who becomes president. We saw that with the Republican and Democrat Conventions and primaries last year. The people did not get to choose their candidates, neither will they get to choose them again this year.
The elites already know who they want to have be the POTUS. Our POTUS has already been decided. I have a feeling it is going to be a Republican this year. You best start getting used to that idea. But that's just a hunch. No one thought that there was a snowball's chance in hell that Bibi would win in Israel, but look what happened, eh? There is a reason for everything, and the reason is the corportacracy.
Of course, it will look like a nail biter again. However, thinking that it can be analyzed and predicted is just being naive. You make all of us chuckle.
Only, that's a lie. Composite polling showed Bush a nose ahead and predicted between 279-286 EV for the President. Better luck next time.
Gesendet von meinem GT-I9515 mit Tapatalk
Fine. If you want to believe in your fantasy world so much, go on then. I already explained to you why Composite polling is way less reliable than exit polls.
The exit polls clearly showed the corruption going on in the system. We know it happens in every other nation. The administration would not allow the UN or foreign observers to monitor our elections, yet you wish to live in a state of denial, go on then, continue to live in your loopy dream world.
My pol is what ALL AMERICANS say they are,
Where is the
Looks like the little nimrod disappeared , I wonder why
What ever you want to believe Statist. If it helps you sleep at night, keep on believing what those research outlets are telling you.
supporting your claim.Sure I can Derideo_Te. My father, my friends. . . and my experience at University. If you bothered to watch that documentary I posted, it might open your eyes. You would see I am not partisan at all.
You know Statist, every time a pollster calls me, and I purposely give them wrong answers, completely at odds with what I think, I smirk and I think of you. When I get off the phone, I get this warm fuzzy feeling of knowing how totally full of shit the media, organizations, and self-righteous folks on the left and the right, just like you, really are.
Thanks for confirming your actual ignorance to me.
Trump is gonna stir some shit up..............It is what he does..........................
And it will force key issues to the front...................and not in a PC way..................which is why I like him...................
And why the GOP and DNC will attack him relentlessly.................................and will try to destroy him..............they don't want to really discuss the key issues in this country.....................they want soft ball questions so they can talk in circles...............saying a whole lot of words that say absolutely nothing................
Hopefully, TRUMP will make them pick a side instead of being a bunch of sniveling whiny bitches this time.....................
Could be entertaining...................as the political chickens dance on the stage............with the agenda already set..........either side of the coin.
I don't "believe" anything. I compare final polls to actual results and bingo, this is how a polling firm builds a track record. Data is data is data.What ever you want to believe Statist. If it helps you sleep at night, keep on believing what those research outlets are telling you.
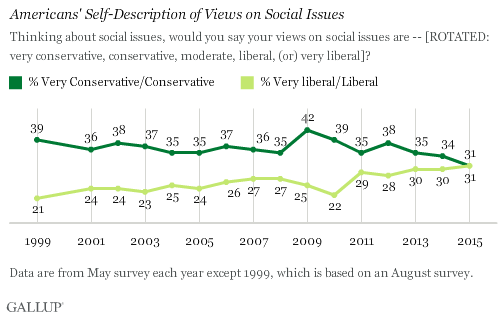
On Social Ideology the Left Catches Up to the RightProbably trying to find which RW disinformation site had that poll.
On Social Ideology the Left Catches Up to the RightProbably trying to find which RW disinformation site had that poll.
I agree. The final exit polls, and the results of the past several elections haven't matched up. Simple.I don't "believe" anything. I compare final polls to actual results and bingo, this is how a polling firm builds a track record. Data is data is data.What ever you want to believe Statist. If it helps you sleep at night, keep on believing what those research outlets are telling you.
As far as demographics are concerned, both the census bureau and Roper are neutral.
I will say it one more time: it's simple math.
Gesendet von meinem GT-I9515 mit Tapatalk
Charlie Cook and David Wasserman just put out an interesting analysis of the 2016 election in terms of demographics, and the concensus is that it looks very, very ugly for the GOP, much uglier than the GOP wants to admit.
So, here we go:
2016 Voters by the Numbers - NationalJournal.com
..through a demographic lens, the modern GOP's increasing reliance on a shrinking pool of older, white, and working-class voters—and its failure to attract nonwhite voters—would seem to present an enormous obstacle to the eventual Republican nominee. In 1980, when nonwhite voters were just 12 percent of the electorate, Ronald Reagan won 56 percent of white voters and was elected in a landslide. But in 2012, when nonwhite voters accounted for 28 percent of the electorate, Mitt Romney took 59 percent of white voters—and lost the presidential race by 4 percentage points. Without a total brand makeover, how can Republicans expect to prevail with an even more diverse electorate in 2016?...
...If the electorate evolves in sync with the Census Bureau's estimates of the adult citizen population (admittedly, a big if), the white share of the electorate would drop from 72 percent in 2012 to 70 percent in 2016; the African-American share would remain stable at 13 percent; the Latino portion would grow from 10 percent to 11 percent; and the Asian/other segment would increase from 5 percent to 6 percent. If the 2012 election had been held with that breakdown (keeping all other variables stable), President Obama would have won by 5.4 percentage points rather than by his actual 3.85-point margin.
In addition, the group with which the GOP does best—whites without college degrees—is the only one poised to shrink in 2016. President Obama won just 36 percent of these voters in 2012, while 42 percent of white voters with college degrees pulled the lever for him. But if the electorate changes in line with census estimates, the slice of college-educated whites will grow by 1 point, to 37 percent of all voters, while the portion of whites without degrees will shrink 3 points, to just 33 percent of the total. In other words, the GOP doesn't just have a growing problem with nonwhites; it has a shrinkage problem as well, as conservative white seniors are supplanted by college-educated millennials with different cultural attitudes.
That's it, in a nutshell.
To back up the stats, here are the exit polls from 1976 through 2012:
How Groups Voted in 1976 - Roper Center
How Groups Voted in 1980 - Roper Center
How Groups Voted in 1984 - Roper Center
How Groups Voted in 1988 - Roper Center
How Groups Voted in 1992 - Roper Center
How Groups Voted in 1996 - Roper Center
How Groups Voted in 2000 - Roper Center
How Groups Voted in 2004 - Roper Center
How Groups Voted in 2008 - Roper Center
How Groups Voted in 2012 - Roper Center
Yes, the statistic from 1980 is correct but at the same time somewhat misleading. Ronald Reagan only took 56% of the White vote in 1980 and still won with a +9.74% landslide over Democratic incumbent Jimmy Carter because it was a three man race and John Anderson (Independent) was also in the mix.
In 1984, the second largest popular vote landslide since 1964 and the largest EV landslide since 1936, Ronald Reagan took 66% of the White Vote, which is the high water mark in this category since Roper has been polling for voter demographics.
The main message is that Romney came close to 60% of the White Vote in 2012 and still lost to Obama by 3.86 points. The reason is obvious: a shrinking White electorate, and a elderly White electorate that is shrinking even more quickly.
So, in 2016, even if for some reason, a GOP nominee were to get 66% of the White Vote as did Ronald Reagan in 1984, since the White Vote is likely to go from 72% of the electorate in 2012 to 70% of the electorate in 2016, that would probably not be enough to get a GOPer over the top in the EC, but maybe in the PV. The problem with that is that no GOPer is likely to get to 66% of the White Vote, because the female vote is already showing a major tendency toward Hillary Clinton (D), also among White Women.
As the data shows, had Obama won with the same groups, but with the projected 2016 demographics, his margin would have been +5.4 over Romney instead of +3.9. That's an automatic 1.5 point difference, just based on expected shifts in the demographics for the next presidential cycle.
The math makes it clear: without inroads into the minority vote, there is no real path for a GOP victory at the national level, plain and simple.
And Charlie Cook's assumption that the White Vote will sink again in 2016 is exactly in line with electoral history. In fact, instead of 70%, I would not be surprised if the White Vote clocks in at 69% in 2016.
Here the exact numbers for the White Vote, vis-a-vis electorate and GOP take of the White vote:
YEAR / % of electorate / Republican take
1976: 89% / 52%
1980: 88% / 56% (three-man-race)
1984: 86% / 66%
1988: 85% / 60%
1992: 87% / 41% (three-man-race)
1996: 83% / 46% (three-man-race)
2000: 81% / 55%
2004: 77% / 58%
2008: 74% / 55%
2012: 72% / 59%
Actually, I think that Charlie Cook's comparison of Reagan to Romney was false. It is much more logical to compare Bush 41 to Romney. In 1988, Bush 41 took 60% of the White Vote and won the election by +7.73%. In 2012, Romney won the White Vote by 59% (he did better than Bush 43 from both 2000 and 2004!), but lost by -3.86%. That's an 11.59% difference, in spite of the fact that both gentlemen took essentially the same amount of the White Vote.
This is how much of a difference the electorate shows when it goes from being 85% White (1988) to 72% White (2012).
Let's look at the shifts as well. In every cycle EXCEPT 1992, the White Vote shrunk over the previous cycle. And since 1996, the White Vote has shrunk by no less than 2% over the previous cycle, so a prediction of 70% for the White Vote in 2016 is absolutely in-line with electoral history.
Also, let's think about the Women's vote:
Obama won the women's vote by +13 in 2008 and by +11 in 2012. Hillary is polling between +15 and +21 in the women's vote and has been the entire time - and I am being VERY conservative with this estimate here: against Ted Cruz, it's +29. Let's take a mean of +18, 5 points higher than Obama's margin from 2012. Assuming 90% of the Black Vote for Hillary, 70% of the Asian Vote and at least 70% of the Latino vote, this can only mean a certain amount of that rise in the women's vote must come from White women voters, which leads to the logical assumption that it is going to be very hard for a Republican to get above 59% of the White Vote overall, much less even hold at 59%.
So, at a time when Donald Trump is holding a mega-anti-immigration rally in a state well known for it's antipathy toward Latinos, namely, Arizona, the demographics are pointing clearly to a need for the Republican nominee to make inroads into the Latino vote.
It's that simple. And it is also the reason for the title of the OP: "The Divide" - because there is a huge divide between that which seems to attract the ultra-conservative majority of the Republican party in a primary election - and that which will attract General Election voters in November 2016.
In other words, the phenomenon of the "red-meat" that Mitt Romney threw to the Right in 2012, which then ended up being a poison-pill for him in the General, appears to be even more prominent looking toward 2016.
George W. Bush (43) managed to get to -9 in the Latino vote in 2004 and he took 58% of the White Vote, and that barely got him over 270 EV (286, to be exact). With a reduced White electorate looming in 2016, a GOPer cannot afford anything worse than -10 in the Latino vote, and it looks like the cleft might be as large as -60. That is a math that they cannot win with.
Yepp, the demographic numbers look brutal for the GOP in 2016.
Translation - The Latino vote at this point is still not as critical as it is being stated to be.Even if Romney had done 10 points better with Latinos in every state in 2012—winning 37 percent instead of 27 percent nationally—he would have won only one additional state: Florida. That's primarily because Latino voters tend to be concentrated in states such as California, New York, and Texas, which aren't Electoral College battlegrounds.
Charlie Cook and David Wasserman just put out an interesting analysis of the 2016 election in terms of demographics, and the concensus is that it looks very, very ugly for the GOP, much uglier than the GOP wants to admit.
So, here we go:
2016 Voters by the Numbers - NationalJournal.com
..through a demographic lens, the modern GOP's increasing reliance on a shrinking pool of older, white, and working-class voters—and its failure to attract nonwhite voters—would seem to present an enormous obstacle to the eventual Republican nominee. In 1980, when nonwhite voters were just 12 percent of the electorate, Ronald Reagan won 56 percent of white voters and was elected in a landslide. But in 2012, when nonwhite voters accounted for 28 percent of the electorate, Mitt Romney took 59 percent of white voters—and lost the presidential race by 4 percentage points. Without a total brand makeover, how can Republicans expect to prevail with an even more diverse electorate in 2016?...
...If the electorate evolves in sync with the Census Bureau's estimates of the adult citizen population (admittedly, a big if), the white share of the electorate would drop from 72 percent in 2012 to 70 percent in 2016; the African-American share would remain stable at 13 percent; the Latino portion would grow from 10 percent to 11 percent; and the Asian/other segment would increase from 5 percent to 6 percent. If the 2012 election had been held with that breakdown (keeping all other variables stable), President Obama would have won by 5.4 percentage points rather than by his actual 3.85-point margin.
In addition, the group with which the GOP does best—whites without college degrees—is the only one poised to shrink in 2016. President Obama won just 36 percent of these voters in 2012, while 42 percent of white voters with college degrees pulled the lever for him. But if the electorate changes in line with census estimates, the slice of college-educated whites will grow by 1 point, to 37 percent of all voters, while the portion of whites without degrees will shrink 3 points, to just 33 percent of the total. In other words, the GOP doesn't just have a growing problem with nonwhites; it has a shrinkage problem as well, as conservative white seniors are supplanted by college-educated millennials with different cultural attitudes.
That's it, in a nutshell.
To back up the stats, here are the exit polls from 1976 through 2012:
How Groups Voted in 1976 - Roper Center
How Groups Voted in 1980 - Roper Center
How Groups Voted in 1984 - Roper Center
How Groups Voted in 1988 - Roper Center
How Groups Voted in 1992 - Roper Center
How Groups Voted in 1996 - Roper Center
How Groups Voted in 2000 - Roper Center
How Groups Voted in 2004 - Roper Center
How Groups Voted in 2008 - Roper Center
How Groups Voted in 2012 - Roper Center
Yes, the statistic from 1980 is correct but at the same time somewhat misleading. Ronald Reagan only took 56% of the White vote in 1980 and still won with a +9.74% landslide over Democratic incumbent Jimmy Carter because it was a three man race and John Anderson (Independent) was also in the mix.
In 1984, the second largest popular vote landslide since 1964 and the largest EV landslide since 1936, Ronald Reagan took 66% of the White Vote, which is the high water mark in this category since Roper has been polling for voter demographics.
The main message is that Romney came close to 60% of the White Vote in 2012 and still lost to Obama by 3.86 points. The reason is obvious: a shrinking White electorate, and a elderly White electorate that is shrinking even more quickly.
So, in 2016, even if for some reason, a GOP nominee were to get 66% of the White Vote as did Ronald Reagan in 1984, since the White Vote is likely to go from 72% of the electorate in 2012 to 70% of the electorate in 2016, that would probably not be enough to get a GOPer over the top in the EC, but maybe in the PV. The problem with that is that no GOPer is likely to get to 66% of the White Vote, because the female vote is already showing a major tendency toward Hillary Clinton (D), also among White Women.
As the data shows, had Obama won with the same groups, but with the projected 2016 demographics, his margin would have been +5.4 over Romney instead of +3.9. That's an automatic 1.5 point difference, just based on expected shifts in the demographics for the next presidential cycle.
The math makes it clear: without inroads into the minority vote, there is no real path for a GOP victory at the national level, plain and simple.
And Charlie Cook's assumption that the White Vote will sink again in 2016 is exactly in line with electoral history. In fact, instead of 70%, I would not be surprised if the White Vote clocks in at 69% in 2016.
Here the exact numbers for the White Vote, vis-a-vis electorate and GOP take of the White vote:
YEAR / % of electorate / Republican take
1976: 89% / 52%
1980: 88% / 56% (three-man-race)
1984: 86% / 66%
1988: 85% / 60%
1992: 87% / 41% (three-man-race)
1996: 83% / 46% (three-man-race)
2000: 81% / 55%
2004: 77% / 58%
2008: 74% / 55%
2012: 72% / 59%
Actually, I think that Charlie Cook's comparison of Reagan to Romney was false. It is much more logical to compare Bush 41 to Romney. In 1988, Bush 41 took 60% of the White Vote and won the election by +7.73%. In 2012, Romney won the White Vote by 59% (he did better than Bush 43 from both 2000 and 2004!), but lost by -3.86%. That's an 11.59% difference, in spite of the fact that both gentlemen took essentially the same amount of the White Vote.
This is how much of a difference the electorate shows when it goes from being 85% White (1988) to 72% White (2012).
Let's look at the shifts as well. In every cycle EXCEPT 1992, the White Vote shrunk over the previous cycle. And since 1996, the White Vote has shrunk by no less than 2% over the previous cycle, so a prediction of 70% for the White Vote in 2016 is absolutely in-line with electoral history.
Also, let's think about the Women's vote:
Obama won the women's vote by +13 in 2008 and by +11 in 2012. Hillary is polling between +15 and +21 in the women's vote and has been the entire time - and I am being VERY conservative with this estimate here: against Ted Cruz, it's +29. Let's take a mean of +18, 5 points higher than Obama's margin from 2012. Assuming 90% of the Black Vote for Hillary, 70% of the Asian Vote and at least 70% of the Latino vote, this can only mean a certain amount of that rise in the women's vote must come from White women voters, which leads to the logical assumption that it is going to be very hard for a Republican to get above 59% of the White Vote overall, much less even hold at 59%.
So, at a time when Donald Trump is holding a mega-anti-immigration rally in a state well known for it's antipathy toward Latinos, namely, Arizona, the demographics are pointing clearly to a need for the Republican nominee to make inroads into the Latino vote.
It's that simple. And it is also the reason for the title of the OP: "The Divide" - because there is a huge divide between that which seems to attract the ultra-conservative majority of the Republican party in a primary election - and that which will attract General Election voters in November 2016.
In other words, the phenomenon of the "red-meat" that Mitt Romney threw to the Right in 2012, which then ended up being a poison-pill for him in the General, appears to be even more prominent looking toward 2016.
George W. Bush (43) managed to get to -9 in the Latino vote in 2004 and he took 58% of the White Vote, and that barely got him over 270 EV (286, to be exact). With a reduced White electorate looming in 2016, a GOPer cannot afford anything worse than -10 in the Latino vote, and it looks like the cleft might be as large as -60. That is a math that they cannot win with.
Yepp, the demographic numbers look brutal for the GOP in 2016.
No. The demographics are based on census data and the Roper presidential exit polling data. Both are non-partisan, with no dog in the race. You are allowed your own opinion, but you are not allowed your own facts.Truth is, Hilly will win if it is Jebster. It is what it is!
The demographics from this person are certainly skewed. Why? Because over 70% of Americans see themselves as conservative, or ultra conservative.
This does NOT mean that our best candidate is Trump. What it DOES mean is that the WORST candidate for the democrats is Hilly or Sanders; and they are in the lead on that side.
Put up a conservative republican who is not a bible thumper, and the democrats will fold like a house of cards. The toughest part of getting a conservative to win the Presidency is NOT the general election, but rather the republican nomination.
Both sides of the aisle have to understand one real truth.............both sides want to keep their power, and rinos and democrats both would rather see someone from the other party in office, instead of a conservative, or libertarian.
It is NOT about the American people, rather it is about the Washington elites from both parties, holding on to power.
This is why if ANY candidate from EITHER side puts up big trouble numbers for Hilly or Jebster, you will see the media attacking those people instantly. What the rino and libs want is, Hilly versus Jebster, so either way they all keep their power.
And guess what. If that is the general election, we as citizens, under either one of them, will lose more, and more of our power and freedom!
Gesendet von meinem GT-I9515 mit Tapatalk
Charlie Cook and David Wasserman just put out an interesting analysis of the 2016 election in terms of demographics, and the concensus is that it looks very, very ugly for the GOP, much uglier than the GOP wants to admit.
So, here we go:
2016 Voters by the Numbers - NationalJournal.com
..through a demographic lens, the modern GOP's increasing reliance on a shrinking pool of older, white, and working-class voters—and its failure to attract nonwhite voters—would seem to present an enormous obstacle to the eventual Republican nominee. In 1980, when nonwhite voters were just 12 percent of the electorate, Ronald Reagan won 56 percent of white voters and was elected in a landslide. But in 2012, when nonwhite voters accounted for 28 percent of the electorate, Mitt Romney took 59 percent of white voters—and lost the presidential race by 4 percentage points. Without a total brand makeover, how can Republicans expect to prevail with an even more diverse electorate in 2016?...
...If the electorate evolves in sync with the Census Bureau's estimates of the adult citizen population (admittedly, a big if), the white share of the electorate would drop from 72 percent in 2012 to 70 percent in 2016; the African-American share would remain stable at 13 percent; the Latino portion would grow from 10 percent to 11 percent; and the Asian/other segment would increase from 5 percent to 6 percent. If the 2012 election had been held with that breakdown (keeping all other variables stable), President Obama would have won by 5.4 percentage points rather than by his actual 3.85-point margin.
In addition, the group with which the GOP does best—whites without college degrees—is the only one poised to shrink in 2016. President Obama won just 36 percent of these voters in 2012, while 42 percent of white voters with college degrees pulled the lever for him. But if the electorate changes in line with census estimates, the slice of college-educated whites will grow by 1 point, to 37 percent of all voters, while the portion of whites without degrees will shrink 3 points, to just 33 percent of the total. In other words, the GOP doesn't just have a growing problem with nonwhites; it has a shrinkage problem as well, as conservative white seniors are supplanted by college-educated millennials with different cultural attitudes.
That's it, in a nutshell.
To back up the stats, here are the exit polls from 1976 through 2012:
How Groups Voted in 1976 - Roper Center
How Groups Voted in 1980 - Roper Center
How Groups Voted in 1984 - Roper Center
How Groups Voted in 1988 - Roper Center
How Groups Voted in 1992 - Roper Center
How Groups Voted in 1996 - Roper Center
How Groups Voted in 2000 - Roper Center
How Groups Voted in 2004 - Roper Center
How Groups Voted in 2008 - Roper Center
How Groups Voted in 2012 - Roper Center
Yes, the statistic from 1980 is correct but at the same time somewhat misleading. Ronald Reagan only took 56% of the White vote in 1980 and still won with a +9.74% landslide over Democratic incumbent Jimmy Carter because it was a three man race and John Anderson (Independent) was also in the mix.
In 1984, the second largest popular vote landslide since 1964 and the largest EV landslide since 1936, Ronald Reagan took 66% of the White Vote, which is the high water mark in this category since Roper has been polling for voter demographics.
The main message is that Romney came close to 60% of the White Vote in 2012 and still lost to Obama by 3.86 points. The reason is obvious: a shrinking White electorate, and a elderly White electorate that is shrinking even more quickly.
So, in 2016, even if for some reason, a GOP nominee were to get 66% of the White Vote as did Ronald Reagan in 1984, since the White Vote is likely to go from 72% of the electorate in 2012 to 70% of the electorate in 2016, that would probably not be enough to get a GOPer over the top in the EC, but maybe in the PV. The problem with that is that no GOPer is likely to get to 66% of the White Vote, because the female vote is already showing a major tendency toward Hillary Clinton (D), also among White Women.
As the data shows, had Obama won with the same groups, but with the projected 2016 demographics, his margin would have been +5.4 over Romney instead of +3.9. That's an automatic 1.5 point difference, just based on expected shifts in the demographics for the next presidential cycle.
The math makes it clear: without inroads into the minority vote, there is no real path for a GOP victory at the national level, plain and simple.
And Charlie Cook's assumption that the White Vote will sink again in 2016 is exactly in line with electoral history. In fact, instead of 70%, I would not be surprised if the White Vote clocks in at 69% in 2016.
Here the exact numbers for the White Vote, vis-a-vis electorate and GOP take of the White vote:
YEAR / % of electorate / Republican take
1976: 89% / 52%
1980: 88% / 56% (three-man-race)
1984: 86% / 66%
1988: 85% / 60%
1992: 87% / 41% (three-man-race)
1996: 83% / 46% (three-man-race)
2000: 81% / 55%
2004: 77% / 58%
2008: 74% / 55%
2012: 72% / 59%
Actually, I think that Charlie Cook's comparison of Reagan to Romney was false. It is much more logical to compare Bush 41 to Romney. In 1988, Bush 41 took 60% of the White Vote and won the election by +7.73%. In 2012, Romney won the White Vote by 59% (he did better than Bush 43 from both 2000 and 2004!), but lost by -3.86%. That's an 11.59% difference, in spite of the fact that both gentlemen took essentially the same amount of the White Vote.
This is how much of a difference the electorate shows when it goes from being 85% White (1988) to 72% White (2012).
Let's look at the shifts as well. In every cycle EXCEPT 1992, the White Vote shrunk over the previous cycle. And since 1996, the White Vote has shrunk by no less than 2% over the previous cycle, so a prediction of 70% for the White Vote in 2016 is absolutely in-line with electoral history.
Also, let's think about the Women's vote:
Obama won the women's vote by +13 in 2008 and by +11 in 2012. Hillary is polling between +15 and +21 in the women's vote and has been the entire time - and I am being VERY conservative with this estimate here: against Ted Cruz, it's +29. Let's take a mean of +18, 5 points higher than Obama's margin from 2012. Assuming 90% of the Black Vote for Hillary, 70% of the Asian Vote and at least 70% of the Latino vote, this can only mean a certain amount of that rise in the women's vote must come from White women voters, which leads to the logical assumption that it is going to be very hard for a Republican to get above 59% of the White Vote overall, much less even hold at 59%.
So, at a time when Donald Trump is holding a mega-anti-immigration rally in a state well known for it's antipathy toward Latinos, namely, Arizona, the demographics are pointing clearly to a need for the Republican nominee to make inroads into the Latino vote.
It's that simple. And it is also the reason for the title of the OP: "The Divide" - because there is a huge divide between that which seems to attract the ultra-conservative majority of the Republican party in a primary election - and that which will attract General Election voters in November 2016.
In other words, the phenomenon of the "red-meat" that Mitt Romney threw to the Right in 2012, which then ended up being a poison-pill for him in the General, appears to be even more prominent looking toward 2016.
George W. Bush (43) managed to get to -9 in the Latino vote in 2004 and he took 58% of the White Vote, and that barely got him over 270 EV (286, to be exact). With a reduced White electorate looming in 2016, a GOPer cannot afford anything worse than -10 in the Latino vote, and it looks like the cleft might be as large as -60. That is a math that they cannot win with.
Yepp, the demographic numbers look brutal for the GOP in 2016.
I hate to say it but you're 100% right. The gop should come out for brith control, exception for abortion in case of rape, incest, etc...Certainly it should be for the family but it needs to play its cards wisely.
I'd say Rubio needs to be on any ticket that the republicans have....
Republicans need to soften their stances on fiscal issues and be for infrastructure, science, r&d and education. It can't afford to be stupid.
Illegals and the non-living still favor Democrats
Illegals and the non-living still favor Democrats
~99% of the Hispanic vote is LEGAL!!!!! Only 46% of that vote even came out in 2012 so you better hope it doesn't come out with a higher percentage and holds 73% towards the democrats as it did in 2012.
It is nearly impossible for the republicans to get 60% or more of the white vote this election. Not with Hillary pulling away white votes with the womans I have a pussy vote.
Republicans are fucked.
