
SSDD
Gold Member
- Nov 6, 2012
- 16,672
- 1,966
- 280
Here is another multi proxy graph of sea level for the past few thousand years...
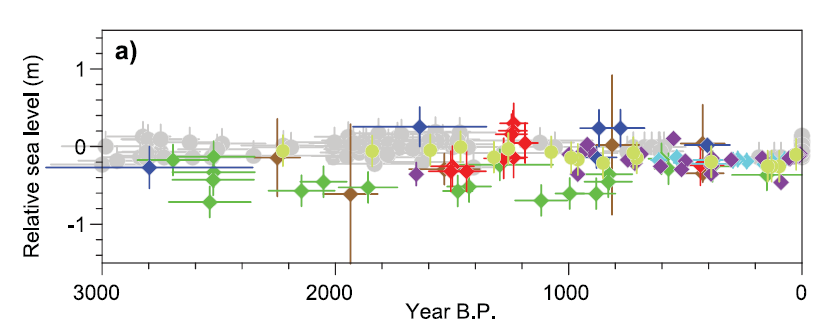
Figure 13.3: (a) Paleo sea level data for last 3000 years from Northern and Southern Hemisphere sites. The effects of glacial isostatic adjustment (GIA) have been removed from these records. Light green = Iceland (Gehrels et al., 2006), purple = Nova Scotia (Gehrels et al., 2005), bright blue = Connecticut (Donnelly et al., 2004), blue = Nova Scotia (Gehrels et al., 2005), red = United Kingdom (Gehrels et al., 2011), green = North Carolina (Kemp et al., 2011), brown = New Zealand (Gehrels et al., 2008), gray = mid-Pacific Ocean (Woodroffe et al., 2012).
You see a massive and global rise in sea level in this graph during the MWP? ! ? ! ? Better give me your car keys...
I have to also say I'm more than a little surprised to see you so reliant on proxies after so many of your other comments.
Who said anything about massive? Again, you can't respond to the actual argument being made, so you make up something to argue against.
As to proxies, I don't think they are so great, but when hundreds upon hundreds find that the RWP and MWP were warmer than the present and global in nature, while one, study and its spinoffs relying on inappopriate proxies and discarding whatever disagrees with it find that the MWP was local and not as warm as the present, I will go with the preponderance of the evidence till something better comes along.

