- Thread starter
- #61
Im having a hard time trying to figure out what you are saying here.
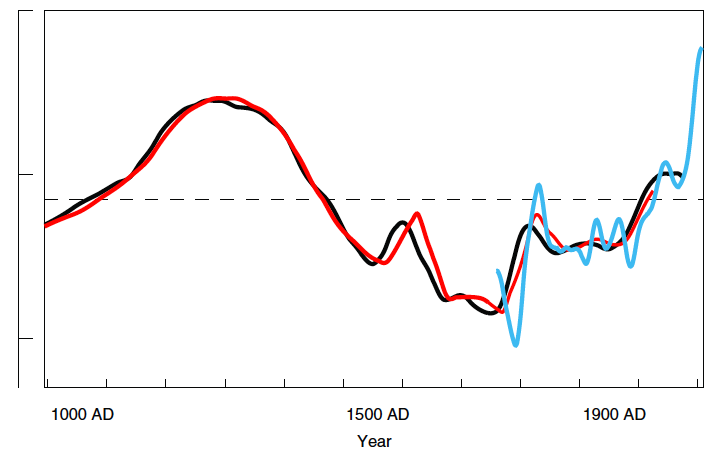
are you suggesting that glass mercury thermometers are the same class of proxy as tree ring widths or 18O cores?
Of course he is. These people have such a skewed world view that they can apparently only see flat surfaces.....hell, he tried to argue with me that anonymous posters on this board suggesting that warmers hold their breath indefinitely to cut down on the CO2 is the same as a public figure, calling for the summary imprisonment and execution of skeptics.
hahahaha. he does seem to have a rather warped sense of proportion with proxies so I can believe his political beliefs would be just as skewed.