Sattelite Data Show 2015 Was NOT EVEN CLOSE to Being Hottest on Record.

The most hardcore denier loons certainly are going overtime with the tantrums. They tend do that on every thread where they get humiliated. So let's do what they hate most, and bring discussion back to the science.

Examine the error bars of the satellite measurement and the surface measurements. Note the error bars of the satellite temperature model output, as defined by the people who created that data, and as compared to the error of the surface temperature direct measurements.

5timescomparevertsmall.jpg


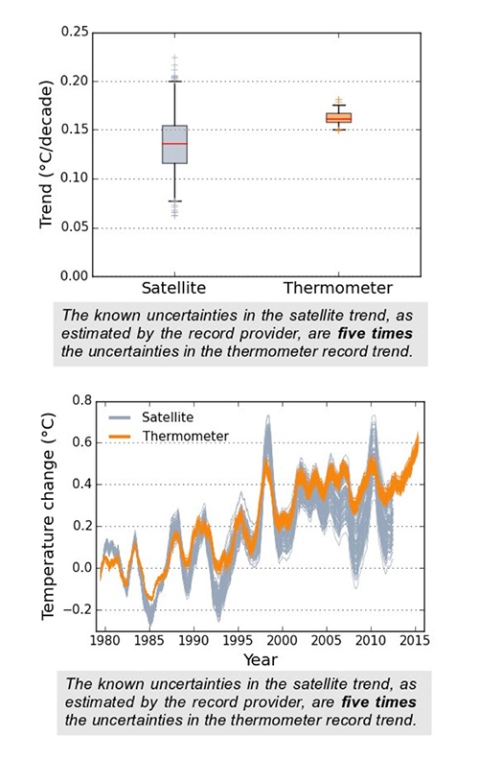
Note that the surface readings fit well within the error range of the satellite readings.

That is, the premise "the surface data is better" is consistent with both the surface and satellite observations, and requires no conspiracy theories.

The premise "the satellite data is better" is not, and thus requires a conspiracy theory to make work.

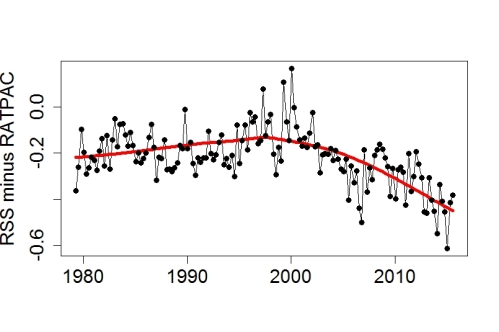
Interesting, don't you think old woman, that the satellite record agrees closely with a million radiosondes....actual measuring devices that require no such adjustment while the surface record with its adjustment after adjustment after adjustment just continues to diverge further and further from both? Clearly you have no critical thinking skills or things like that would set you thinking.....or are you going to claim that the radiosondes are lying also?
 
You're ignoring those error bars.
800px-HeatIsland_Kanto_en.png


crick- this is a wonderful example to practice your graph reading skills on!

-five cities, all with the same basic shape
-how much rise? I prefer to start at 1925 because there is a distinct peak there so we can easily check the difference out to 2007
- in order, 0.5, 1.7, 1.2, 1.2, -0.1 . tokyo rose the most, katsuura the least, yokohama already seems odd
-quick google of the populations. in order (x100,000) 37, 90, 2, 3, 0.2. too much trouble to find out past population. 2 big cities, two smaller cities, one town.
-check locations. yok and tok on inland bay, kum and mae inland to the NE of tok, katsuura is a small fishing village on the outside coast.

does it make sense? small village on ocean with smallest trend, seems OK. two large cities, one with large trend and one with much smaller trend even though the cities run into each other. Yokohama seems to be an outlier for some reason. two small cities close to each other farther inland with little water interaction, showing moderate increase, seems OK.

interesting results, more or less as expected less Yokohama. why is there not more warming overall? the graph states for september only, could be why.

things to check out....

-is this graph associated with a paper giving more details?
-does the yearly graph for tokyo and yokohama show the same discrepancy?
-was there something in the history of yokohama that might have an effect, eg steel plants moving out, aluminium smelter closed, etc....


The point, Ian, the fucking context here, is that Billy Boy claims that UHI effects have required 5-8F adjustments to the temperature records. Now FCT claims that we must be talking about somewhere in Alaska where he "KNOWS" they've had differences that high. I'm so glad he knows. Let's see the fucking link from Billy Boy or any of the rest of you who feel like standing up for your atmospheric physicist at large:

I find it telling that you failed to disclose the failure of finding and correcting UHI and how it biased the records by a whopping +5.0 - 8.0 deg F (+3-5 deg C)


which error bars are you talking about?

why do I have to support BB? havent I called him a Cliff Clavin, or an embarrassment to the skeptical side, often enough for you?

UHI is an example of obvious mistakes that sit on the books because fixing them would lessen the trend. probably not even that much. but to leave it unresolved is a slap in the face to science. your graph shows Tokyo with a 2.5C/ century trend, and a fishing village with only a 0.4C/century trend. is some of that 2C+ difference UHI? how about the two smaller cities with a trend over 1C higher than the rural station? how much is UHI?

show me where UHI is deleted from the trend. I showed you a paper that analyzed GISS adjustment for UHI, and they added up to zero. do you honestly believe that a town going from 2000 to 25000 population has no UHI effect? how about a city going from 2 million to 10 million? all the extra buildings and roads have no effect? perhaps you agree with Berkeley BEST when they say UHI actually causes COOLING! and therefore temperature readings need to be adjusted up, of course.

you were given the example of Barrow, Alaska. they measured the UHI at roughly 2C in the 2000's. can we assume it was lower when Barrow was first established? how much of that 2C is removed from the records?

flac mentioned Fairbanks I think. I saw a graph of adjustments for that town. it had the two leg adjustment, and while they did remove some UHI effect in the first leg, they promptly added it back in the second leg. do you think Fairbanks would have a substantial UHI effect? yes or no.
 
I think that the NOAA, NCDC and Hadley investigations into UHI effects were conclusive. I think appropriate adjustments for UHI have been made to all the major datasets and it is no longer an issue. I am quite certain it was never the issue that Watts et al attempted to make of it. And I am still waiting to hear from Billy Boy as to the source of his 5-8F adjustment claim.

Ian, you're a smart guy. What makes you think that your ability to nit pick in this manner means we should not believe the IPCC conclusions?
 
Interesting, don't you think old woman,

Once more, you old perv , I'll ask you to stop hitting on me and all the other men here. It's creepy.

that the satellite record agrees closely with a million radiosondes....actual measuring devices that require no such adjustment while the surface record with its adjustment after adjustment after adjustment just continues to diverge further and further from both? Clearly you have no critical thinking skills or things like that would set you thinking.....or are you going to claim that the radiosondes are lying also?

No, I'll point out that you're just lying about the data. Again. It's what you do. It's all you do.

The radiosonde data matches the surface temperature record closely, but started diverging from the satellite model output around 2000, and is now wildly different from the satellite model output.

Radiosonde Atmospheric Temperature Products for Accessing Climate (RATPAC) | National Centers for Environmental Information (NCEI) formerly known as National Climatic Data Center (NCDC)

compare_overlap.jpeg


diff.jpeg


We've been over this before. Just to save time, I'll summarize how this goes.

I provide the hard data and the graph of that hard data.

You refuse to provide anything beyond DearLeaderSpencer's fudged mystery graph.

Then you throw a tantrum when nobody else will believe your unsupported claims purely on faith, as you do.

Anything new you'd like to add?

Are you sure you have the right "baseline"?
 
Where'd you find THAT turdish crock??

Somewhere on Climate Crocks. If you weren't forbidden from looking at actual science out of fear you might learn something, you could check it out.

Probably taking the data prior to adjusting to Tof Observation due to orbit. Doesn't matter much.

There are TWO INDEPENDENT methodologies used to produce 2 DIFFERENT satellite records. And THEY agree brilliantly.

That's because they're essentially just one record. RSS and UAH use exactly the same sensors, and as of UAH 6.0, almost exactly the same algorithm.

Most likely that would never happen if the data was as bad as your turdish crock asserts.

Go ask RSS what their FINAL error bars are and quit looking for the trolls under the bridge that give you the answers you search Google for.

Okay. Here's what Dr. Mears of RSS says.

Earth's temperature depends on where you put thermometer
---
Mears said his analysis of his own satellite data has five times the margin of error of ground measurements.
---

Now, if you want to claim Dr. Mears is wrong, you ought to show us your evidence. I suggest you get on board with Dr. Mears, as he's a bit of a lukewarmer, and his positions will make a good place to fall back on gracefully as your own positions become untenable.


Earth's temperature depends on where you put thermometer

Funny, it depends on where you put the thermometer. I totally fkn agree. Just in Alaska depending on the placement, it could be 30 degrees difference between two cities. One state and a difference of 30 degrees. 34 degrees right now in Anchorage and it's 3 degrees in Barrows. I completely agree

BTW, I rest my case on fudging data.
 
Last edited:
I think that the NOAA, NCDC and Hadley investigations into UHI effects were conclusive. I think appropriate adjustments for UHI have been made to all the major datasets and it is no longer an issue. I am quite certain it was never the issue that Watts et al attempted to make of it. And I am still waiting to hear from Billy Boy as to the source of his 5-8F adjustment claim.

Ian, you're a smart guy. What makes you think that your ability to nit pick in this manner means we should not believe the IPCC conclusions?

NOAA, you mean the 1997 temperature was 62F NOAA?
 
Interesting, don't you think old woman,

Once more, you old perv , I'll ask you to stop hitting on me and all the other men here. It's creepy.

that the satellite record agrees closely with a million radiosondes....actual measuring devices that require no such adjustment while the surface record with its adjustment after adjustment after adjustment just continues to diverge further and further from both? Clearly you have no critical thinking skills or things like that would set you thinking.....or are you going to claim that the radiosondes are lying also?

No, I'll point out that you're just lying about the data. Again. It's what you do. It's all you do.

The radiosonde data matches the surface temperature record closely, but started diverging from the satellite model output around 2000, and is now wildly different from the satellite model output.

Radiosonde Atmospheric Temperature Products for Accessing Climate (RATPAC) | National Centers for Environmental Information (NCEI) formerly known as National Climatic Data Center (NCDC)

compare_overlap.jpeg


diff.jpeg


We've been over this before. Just to save time, I'll summarize how this goes.

I provide the hard data and the graph of that hard data.

You refuse to provide anything beyond DearLeaderSpencer's fudged mystery graph.

Then you throw a tantrum when nobody else will believe your unsupported claims purely on faith, as you do.

Anything new you'd like to add?
compare_overlap.jpeg


Funny how the RSS lines up with the RATPAC until 2011/12. What the fk?
 
Can you imagine how big the current cold snap must be?

The only way the Warmers make their numbers work is by erasing temperatures from 1997 PLUS that have to add in the accounting fiction of "excess heat" eaten by the deep oceans.....

.... and THEY'RE STILL 4F BELOW 1997!!!!
 
God are you stupid. The WORLD is not having a cold snap you fucking scrotal sack. The WORLD is hotter than it has been for 135 years.

images
 
I think that the NOAA, NCDC and Hadley investigations into UHI effects were conclusive. I think appropriate adjustments for UHI have been made to all the major datasets and it is no longer an issue. I am quite certain it was never the issue that Watts et al attempted to make of it. And I am still waiting to hear from Billy Boy as to the source of his 5-8F adjustment claim.

Ian, you're a smart guy. What makes you think that your ability to nit pick in this manner means we should not believe the IPCC conclusions?


I'm glad you think I'm a smart guy. then why are you so recalcitrant to investigate anything I suggest for yourself?

you posted a wonderful graph on UHI. it was so much fun to deconstruct into parts and then see how the parts fit together. did you try to analyze it for yourself? if not, then why are you here? you're not going to change anybody's mind. the only reward for reading and posting here is that you occasionally get exposed to information and ideas that you havent heard or thought about by yourself.
 
My daughter is getting married tomorrow. Makes you think about the futre. There are massive amounts of information and ideas that tell us AGW is real and a threat. I choose to accept that and work to fight it. You choose to fight reality by coming here to nitpick. Reminds me very much of people I used to argue with who thought evolution and the Big Bang theory weren't supported by the evidence. They would bring up debates between the linear and the punctuated equilibrium folks in an attempt to show that there was some huge internal debate on the topic and that it wasn't accepted science. They would pull obscure details and try to use them to prove that radiological dating didn't work or that all the evidence supported Noah's Flood. They claimed that there were many scientists that rejected evolution and the Big Bang but that their opinions were suppressed by those in charge: by the journals, by government, by liberals who wanted to use the myths of science to gain added control over everyone's lives.

I guess that's where you want to be. I want to look into my children's future and see some hope that we're not giving them a world headed into the sort of disaster not seen in 252 million years.
 
IPCC on UHI. first up on google is the AR4. 3.2.2.2 Urban Heat Islands and Land Use Effects - AR4 WGI Chapter 3: Observations: Surface and Atmospheric Climate Change

OK, interesting. first they acknowledge that many papers have indeed identified a warming effect for urbanization. but then they question whether that warming affects the trend with statements like, Over the conterminous USA, after adjustment for time-of-observation bias and other changes, rural station trends were almost indistinguishable from series including urban sites.

the words 'after' and 'almost' leave me wondering...

Parker's wind vs calm paper is there. so is McKitrick's multivariate paper. as was de Laat's paper on energy usage. big cities like NewYork or Tokyo use over 100W/m^2. I wonder how much of that ends up as waste heat?
 
My daughter is getting married tomorrow. Makes you think about the futre. There are massive amounts of information and ideas that tell us AGW is real and a threat. I choose to accept that and work to fight it. You choose to fight reality by coming here to nitpick. Reminds me very much of people I used to argue with who thought evolution and the Big Bang theory weren't supported by the evidence. They would bring up debates between the linear and the punctuated equilibrium folks in an attempt to show that there was some huge internal debate on the topic and that it wasn't accepted science. They would pull obscure details and try to use them to prove that radiological dating didn't work or that all the evidence supported Noah's Flood. They claimed that there were many scientists that rejected evolution and the Big Bang but that their opinions were suppressed by those in charge: by the journals, by government, by liberals who wanted to use the myths of science to gain added control over everyone's lives.

I guess that's where you want to be. I want to look into my children's future and see some hope that we're not giving them a world headed into the sort of disaster not seen in 252 million years.


changing the subject again? now I not only have to answer for Billy Bob's nonsense but everyone else that you have ever disagreed with?

I am sorry that I ever tried to converse with you. I can see it was unwelcome.

GL with the wedding.
 
Of course it was unwelcome. I didn't come here for entertainment, I came here to save the world.

But thanks for the good wishes.
 
Interesting, don't you think old woman,

Once more, you old perv , I'll ask you to stop hitting on me and all the other men here. It's creepy.

So you are so desperate that you believe that someone calling you a dried up bitter old woman is hitting on you? If being called an old woman represents being hit on in your mind, it is little wonder that you have a first class seat on the AGW crazy train...as to the rest of your post...it is just AGW wacko BS....here is what the truth looks like...

Climate-Chart-mikulich.png
 
When I pointed out that all you have is Spencer's fudged graph, pasting in Spencer's fudged graph yet another time was probably not the best tactic you could have chosen.

I showed where to get the hard data for RATPAC, which is the gold standard of global weather balloon measurements of the upper troposphere. Go download it and compare it to RSS yourself, and you'll be able to see how, compared to the radiosondes, the satellite temperature model outputs have been steadily drifting to the cool side since 2000.
Only fudged in the minds of deluded twits....
 
You're ignoring those error bars.
800px-HeatIsland_Kanto_en.png


crick- this is a wonderful example to practice your graph reading skills on!

-five cities, all with the same basic shape
-how much rise? I prefer to start at 1925 because there is a distinct peak there so we can easily check the difference out to 2007
- in order, 0.5, 1.7, 1.2, 1.2, -0.1 . tokyo rose the most, katsuura the least, yokohama already seems odd
-quick google of the populations. in order (x100,000) 37, 90, 2, 3, 0.2. too much trouble to find out past population. 2 big cities, two smaller cities, one town.
-check locations. yok and tok on inland bay, kum and mae inland to the NE of tok, katsuura is a small fishing village on the outside coast.

does it make sense? small village on ocean with smallest trend, seems OK. two large cities, one with large trend and one with much smaller trend even though the cities run into each other. Yokohama seems to be an outlier for some reason. two small cities close to each other farther inland with little water interaction, showing moderate increase, seems OK.

interesting results, more or less as expected less Yokohama. why is there not more warming overall? the graph states for september only, could be why.

things to check out....

-is this graph associated with a paper giving more details?
-does the yearly graph for tokyo and yokohama show the same discrepancy?
-was there something in the history of yokohama that might have an effect, eg steel plants moving out, aluminium smelter closed, etc....


The point, Ian, the fucking context here, is that Billy Boy claims that UHI effects have required 5-8F adjustments to the temperature records. Now FCT claims that we must be talking about somewhere in Alaska where he "KNOWS" they've had differences that high. I'm so glad he knows. Let's see the fucking link from Billy Boy or any of the rest of you who feel like standing up for your atmospheric physicist at large:

I find it telling that you failed to disclose the failure of finding and correcting UHI and how it biased the records by a whopping +5.0 - 8.0 deg F (+3-5 deg C)

In areas of the arctic and antarctic this is indeed the case. This is precisely the area they targeted to get the best bang for their buck and the most temperature rise in the global record.
 

Forum List

Back
Top