Sattelite Data Show 2015 Was NOT EVEN CLOSE to Being Hottest on Record.

The most hardcore denier loons certainly are going overtime with the tantrums. They tend do that on every thread where they get humiliated. So let's do what they hate most, and bring discussion back to the science.

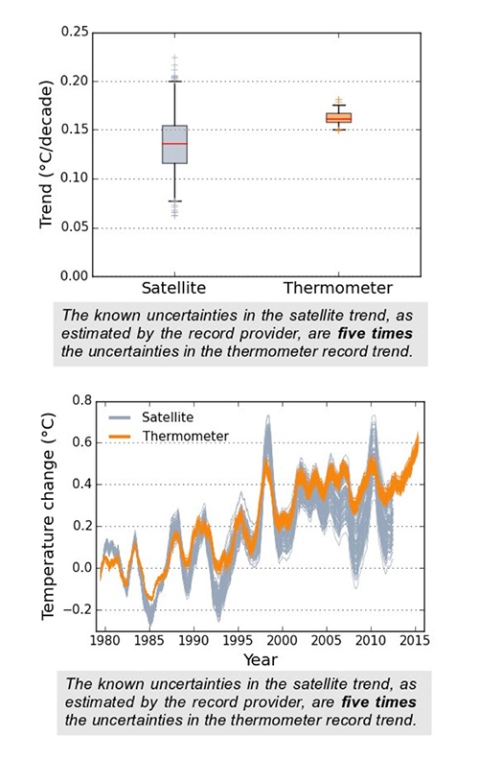
Examine the error bars of the satellite measurement and the surface measurements. Note the error bars of the satellite temperature model output, as defined by the people who created that data, and as compared to the error of the surface temperature direct measurements.
5timescomparevertsmall.jpg


Note that the surface readings fit well within the error range of the satellite readings.

That is, the premise "the surface data is better" is consistent with both the surface and satellite observations, and requires no conspiracy theories.

The premise "the satellite data is better" is not, and thus requires a conspiracy theory to make work.
 
The most hardcore denier loons certainly are going overtime with the tantrums. They tend do that on every thread where they get humiliated. So let's do what they hate most, and bring discussion back to the science.

Examine the error bars of the satellite measurement and the surface measurements. Note the error bars of the satellite temperature model output, as defined by the people who created that data, and as compared to the error of the surface temperature direct measurements.

5timescomparevertsmall.jpg


Note that the surface readings fit well within the error range of the satellite readings.

That is, the premise "the surface data is better" is consistent with both the surface and satellite observations, and requires no conspiracy theories.

The premise "the satellite data is better" is not, and thus requires a conspiracy theory to make work.

And again you tell half the truth and lie out your ass... Satellite data has crossed into the realm of greater accuracy than the surface (HCN record) as it is not biased by mans encroachment and it covers 86% of the surface of the globe While physical thermometer measurements cover just 21% of the globe. The rest of the measurements are created out of thin air and algorithms (fantasy bull shit). I find it telling that you failed to disclose the failure of finding and correcting UHI and how it biased the records by a whopping +5.0 - 8.0 deg F (+3-5 deg C)

Your uncertainty bars for the HCN are total bullshit as are your grossly over-sized error bars for UAH and RSS.

I'll take the satellite measurements over your highly adjust HCN crap any day of the week.
 
I find it telling that you failed to disclose the failure of finding and correcting UHI and how it biased the records by a whopping +5.0 - 8.0 deg F (+3-5 deg C)

Where the fuck did you get that fantasy? Anal derivation is not acceptable here or anywhere else outside your personal WC.
 
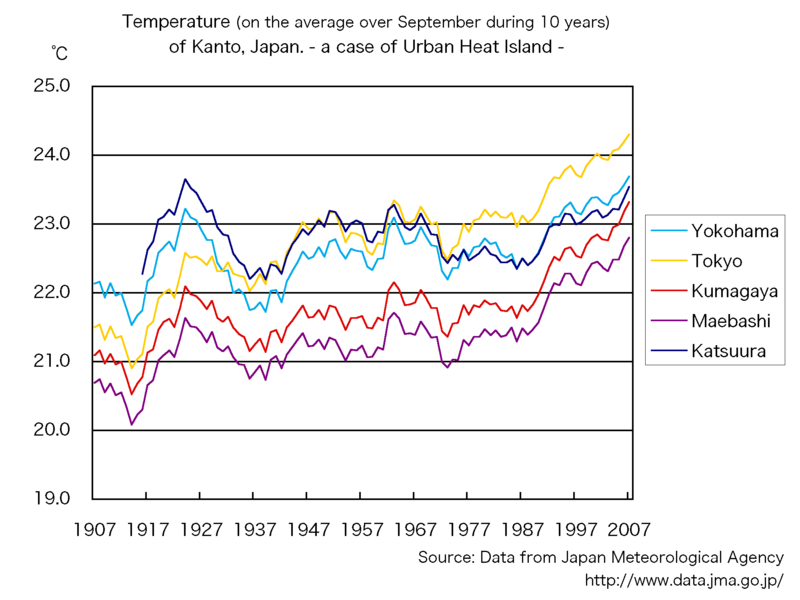
Here is the cumulative UHI effect for 100 years for fucking TOKYO: 1907and 2007. This looks like a total of less than 1.5C vs any of these other areas..
800px-HeatIsland_Kanto_en.png
 
From TAR

However, over the Northern Hemisphere land areas where urban heat islands are most apparent, both the trends of lower-tropospheric temperature and surface air temperature show no significant differences. In fact, the lower-tropospheric temperatures warm at a slightly greater rate over North America (about 0.28°C/decade using satellite data) than do the surface temperatures (0.27°C/decade), although again the difference is not statistically significant.[21]

A quarter of a degree and not statistically significant. So, where the fuck do you get 5-8C?

From FAR

Studies that have looked at hemispheric and global scales conclude that any urban-related trend is an order of magnitude smaller than decadal and longer time-scale trends evident in the series (e.g., Jones et al., 1990; Peterson et al., 1999). This result could partly be attributed to the omission from the gridded data set of a small number of sites (<1%) with clear urban-related warming trends. In a worldwide set of about 270 stations, Parker (2004, 2006) noted that warming trends in night minimum temperatures over the period 1950 to 2000 were not enhanced on calm nights, which would be the time most likely to be affected by urban warming. Thus, the global land warming trend discussed is very unlikely to be influenced significantly by increasing urbanisation (Parker, 2006). ... Accordingly, this assessment adds the same level of urban warming uncertainty as in the TAR: 0.006°C per decade since 1900 for land, and 0.002°C per decade since 1900 for blended land with ocean, as ocean UHI is zero.[121]

And, from Wikipedia

Studies in 2004 and 2006 attempted to test the urban heat island theory, by comparing temperature readings taken on calm nights with those taken on windy nights.[109][110] If the urban heat island theory is correct then instruments should have recorded a bigger temperature rise for calm nights than for windy ones, because wind blows excess heat away from cities and away from the measuring instruments. There was no difference between the calm and windy nights, and one study said that "we show that, globally, temperatures over land have risen as much on windy nights as on calm nights, indicating that the observed overall warming is not a consequence of urban development."[109][111]
 
“The whole aim of practical politics is to keep the populace alarmed (and hence clamorous to be led to safety) by menacing it with an endless series of hobgoblins, all of them imaginary.” ----- H. L. Mencken

I think this quote sums up the crap nicely..
 
One more time. Let's see a link that shows a 5-8F degree adjustment being made for UHI affects.
 
The Urban Heat Island Effect is real. It is obvious in any IR photo of a city. Or just ask a gardener.

Even small communities can have significant effects, Barrow Alaska was found to have a ~2C difference.

The problem is how to quantify it, and how to adjust for it.

Up until 2011 GISS had a separate UHI adjustment, broken into two legs before and after ~1950. Logically you would think the adjustment would either warm the past or cool the recent, to remove UHI. This did not happen. The net adjustment was zero. No change whatsoever for UHI.

Let's go back to Barrow. Sometime between the time when it was an outpost with a few dwellings until now with several thousand inhabitants, it has developed a 2C UHI, as measured in the early 2000's. Where does that 2C go? Into the trend. Natural and artificial warming is lumped together with no way to separate them.

Crick cited a paper that 'proved' there was no UHI because windy nights were not significantly cooler than calm ones. You can believe a paper that perhaps had a predetermined outcome, or you can take a ride in your car and watch the outside temp drop as you drive out of the city and warm up again as you return.
 
Crick cited a paper that 'proved' there was no UHI

No, he didn't.

The paper talked about the _trend_ of UHI, not UHI.

So why did you make such bonehead error? As usual, you projected your own way of thinking on to the fair and rational people here. You had a predetermined outcome in mind, and you were going to reach that outcome no matter what the data said. You wanted so badly to believe that those egghead scientists were such big frauds that they'd deny UHI exists, so you saw in the paper something other than what it said.

That's how all your "science" works. You're too blinded by your predetermined biases to be a rational actor. Thanks for illustrating it so clearly here.

Everyone knows there's UHI. Your rants about how it exists are a red herring, a strawman, as everyone knows it exists. UHI won't affect a warming trend if there's a constant UHI. It would only matter if the UHI-affected temp was growing at a faster rate than surrounding areas. And as paper after paper has shown, that's not the case. Urban areas have been warming at the same or at a slightly lesser rate than non-urban areas, hence it is conclusively demonstrated that global arming is not an artifact of UHI.
 
The most hardcore denier loons certainly are going overtime with the tantrums. They tend do that on every thread where they get humiliated. So let's do what they hate most, and bring discussion back to the science.

Examine the error bars of the satellite measurement and the surface measurements. Note the error bars of the satellite temperature model output, as defined by the people who created that data, and as compared to the error of the surface temperature direct measurements.

5timescomparevertsmall.jpg


Note that the surface readings fit well within the error range of the satellite readings.

That is, the premise "the surface data is better" is consistent with both the surface and satellite observations, and requires no conspiracy theories.

The premise "the satellite data is better" is not, and thus requires a conspiracy theory to make work.


nobody cares about .4 degree's s0n!!:2up: Only religious nutters who get angst over pretty much everything!!!

That's why you get polls that look like THIS >>>>
( conducted last week btw :fu: )

[URL='http://s42.photobucket.com/user/baldaltima/media/pew-priorities.jpg.html'][/URL]


:spinner::spinner::spinner::spinner::spinner:
 
The most hardcore denier loons certainly are going overtime with the tantrums. They tend do that on every thread where they get humiliated. So let's do what they hate most, and bring discussion back to the science.

Examine the error bars of the satellite measurement and the surface measurements. Note the error bars of the satellite temperature model output, as defined by the people who created that data, and as compared to the error of the surface temperature direct measurements.

5timescomparevertsmall.jpg


Note that the surface readings fit well within the error range of the satellite readings.

That is, the premise "the surface data is better" is consistent with both the surface and satellite observations, and requires no conspiracy theories.

The premise "the satellite data is better" is not, and thus requires a conspiracy theory to make work.
Your chart shows no warming since 1997
 
The most hardcore denier loons certainly are going overtime with the tantrums. They tend do that on every thread where they get humiliated. So let's do what they hate most, and bring discussion back to the science.

Examine the error bars of the satellite measurement and the surface measurements. Note the error bars of the satellite temperature model output, as defined by the people who created that data, and as compared to the error of the surface temperature direct measurements.

5timescomparevertsmall.jpg


Note that the surface readings fit well within the error range of the satellite readings.

That is, the premise "the surface data is better" is consistent with both the surface and satellite observations, and requires no conspiracy theories.

The premise "the satellite data is better" is not, and thus requires a conspiracy theory to make work.

Where'd you find THAT turdish crock??

Probably taking the data prior to adjusting to Tof Observation due to orbit. Doesn't matter much. There are TWO INDEPENDENT methodologies used to produce 2 DIFFERENT satellite records. And THEY agree brilliantly.

Most likely that would never happen if the data was as bad as your turdish crock asserts.

Go ask RSS what their FINAL error bars are and quit looking for the trolls under the bridge that give you the answers you search Google for.
 
Where'd you find THAT turdish crock??

Somewhere on Climate Crocks. If you weren't forbidden from looking at actual science out of fear you might learn something, you could check it out.

Probably taking the data prior to adjusting to Tof Observation due to orbit. Doesn't matter much.

There are TWO INDEPENDENT methodologies used to produce 2 DIFFERENT satellite records. And THEY agree brilliantly.

That's because they're essentially just one record. RSS and UAH use exactly the same sensors, and as of UAH 6.0, almost exactly the same algorithm.

Most likely that would never happen if the data was as bad as your turdish crock asserts.

Go ask RSS what their FINAL error bars are and quit looking for the trolls under the bridge that give you the answers you search Google for.

Okay. Here's what Dr. Mears of RSS says.

Earth's temperature depends on where you put thermometer
---
Mears said his analysis of his own satellite data has five times the margin of error of ground measurements.
---

Now, if you want to claim Dr. Mears is wrong, you ought to show us your evidence. I suggest you get on board with Dr. Mears, as he's a bit of a lukewarmer, and his positions will make a good place to fall back on gracefully as your own positions become untenable.

 
Anchorage -- smaller Alaskan cities up there. Wouldn't be surprised if the UHI NEEDED to be 4 or 6 degs --- because I KNOW it's been observed to be that high..

He didn't ask you to give an example of a UHI of 5-8F.

He asked for an example of a UHI that biased the anomaly record to that extent. That is, an uncorrected growth of a UHI.

You and Ian just both have a great deal of trouble understanding how UHI affects the temperature record.
 
Where'd you find THAT turdish crock??

Somewhere on Climate Crocks. If you weren't forbidden from looking at actual science out of fear you might learn something, you could check it out.

Probably taking the data prior to adjusting to Tof Observation due to orbit. Doesn't matter much.

There are TWO INDEPENDENT methodologies used to produce 2 DIFFERENT satellite records. And THEY agree brilliantly.

That's because they're essentially just one record. RSS and UAH use exactly the same sensors, and as of UAH 6.0, almost exactly the same algorithm.

Most likely that would never happen if the data was as bad as your turdish crock asserts.

Go ask RSS what their FINAL error bars are and quit looking for the trolls under the bridge that give you the answers you search Google for.

Okay. Here's what Dr. Mears of RSS says.

Earth's temperature depends on where you put thermometer
---
Mears said his analysis of his own satellite data has five times the margin of error of ground measurements.
---

Now, if you want to claim Dr. Mears is wrong, you ought to show us your evidence. I suggest you get on board with Dr. Mears, as he's a bit of a lukewarmer, and his positions will make a good place to fall back on gracefully as your own positions become untenable.


Karl couldn't beat his way out of a wet paper bag.. He's been shown wrong so many times he isn't worth citing for anything..

What I must give him props for, he has not bastardized his data yet and clings to hard factual data sets. The error bars are much smaller than those of the HCN but he chooses to not acknowledge this. He is fully in the alarmist camp and he is maddened that his data and work have only proved the CAGW meme a fraud.
 
800px-HeatIsland_Kanto_en.png


crick- this is a wonderful example to practice your graph reading skills on!

-five cities, all with the same basic shape
-how much rise? I prefer to start at 1925 because there is a distinct peak there so we can easily check the difference out to 2007
- in order, 0.5, 1.7, 1.2, 1.2, -0.1 . tokyo rose the most, katsuura the least, yokohama already seems odd
-quick google of the populations. in order (x100,000) 37, 90, 2, 3, 0.2. too much trouble to find out past population. 2 big cities, two smaller cities, one town.
-check locations. yok and tok on inland bay, kum and mae inland to the NE of tok, katsuura is a small fishing village on the outside coast.

does it make sense? small village on ocean with smallest trend, seems OK. two large cities, one with large trend and one with much smaller trend even though the cities run into each other. Yokohama seems to be an outlier for some reason. two small cities close to each other farther inland with little water interaction, showing moderate increase, seems OK.

interesting results, more or less as expected less Yokohama. why is there not more warming overall? the graph states for september only, could be why.

things to check out....

-is this graph associated with a paper giving more details?
-does the yearly graph for tokyo and yokohama show the same discrepancy?
-was there something in the history of yokohama that might have an effect, eg steel plants moving out, aluminium smelter closed, etc....
 
station.gif


station.gif


GISS v2. not a particularly good fit for two cities close together.

station.gif


station.gif


GISS v3. worse. note well that Yokohama's record here ends in 1990. funny how the 1980's are quite different. (edit. I must admit that these two cities show much less change from v2 to v3 than I usually see ROW cities)

no time right now.

crick, perhaps you could parse the graph, find some outside information, and make some interesting comments based on the evidence you see or find.
 
so crick, did you bother? doesnt seem like it.

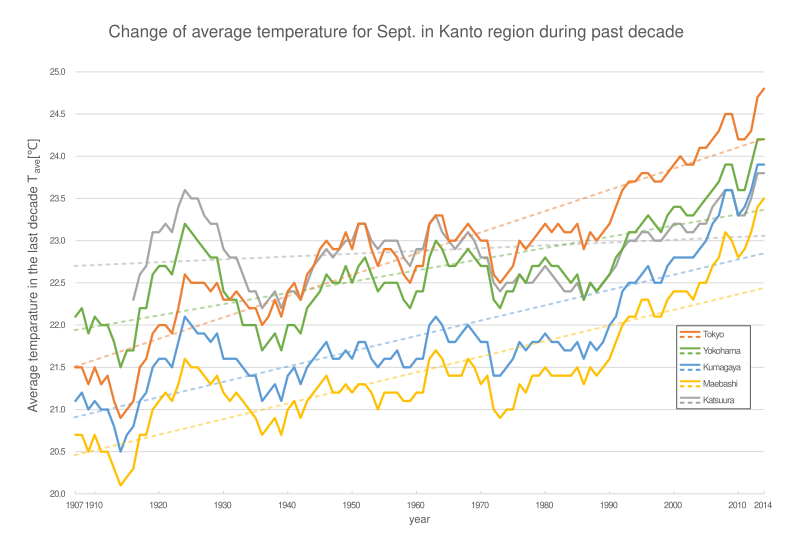
here is an updated graph, with trend lines-

800px-Heat_island_in_Kanto_region_1907-2014.svg.png


they use an odd form of ten year avg, all in arrear. that's why it seemed so disjointed to actual readings I suppose.

[TBODY][TR][TH="colspan: 2"]Tokyo[/TH][TH="colspan: 2"]Yokohama[/TH][TH="colspan: 2"]Kumagaya[/TH][TH="colspan: 2"]Maebashi[/TH][TH="colspan: 2"]Katsuura[/TH][/TR]
[TR][TH="bgcolor: rgb(242, 242, 242)"]year[/TH][TH="bgcolor: rgb(242, 242, 242)"]temp.[/TH][TH="bgcolor: rgb(242, 242, 242)"]ave.[/TH][TH="bgcolor: rgb(242, 242, 242)"]temp.[/TH][TH="bgcolor: rgb(242, 242, 242)"]ave.[/TH][TH="bgcolor: rgb(242, 242, 242)"]temp.[/TH][TH="bgcolor: rgb(242, 242, 242)"]ave.[/TH][TH="bgcolor: rgb(242, 242, 242)"]temp.[/TH][TH="bgcolor: rgb(242, 242, 242)"]ave.[/TH][TH="bgcolor: rgb(242, 242, 242)"]temp.[/TH][TH="bgcolor: rgb(242, 242, 242)"]ave.[/TH][/TR]
[TR][TD]1897[/TD][TD]20.9[/TD][TD]21.6[/TD][TD]20.4[/TD][TD]20.1[/TD][/TR]
[TR][TD]1898[/TD][TD]21.6[/TD][TD]22.3[/TD][TD]21.1[/TD][TD]20.5[/TD][/TR]
[TR][TD]1899[/TD][TD]19.8[/TD][TD]20.4[/TD][TD]19.6[/TD][TD]19.3[/TD][/TR]
[TR][TD]1900[/TD][TD]22.6[/TD][TD]23.2[/TD][TD]22.1[/TD][TD]21.7[/TD][/TR]
[TR][TD]1901[/TD][TD]22.3[/TD][TD]22.9[/TD][TD]21.7[/TD][TD]21.2[/TD][/TR]
[TR][TD]1902[/TD][TD]22.6[/TD][TD]23.2[/TD][TD]22.3[/TD][TD]21.7[/TD][/TR]
[TR][TD]1903[/TD][TD]22.3[/TD][TD]22.9[/TD][TD]22.1[/TD][TD]21.9[/TD][/TR]
[TR][TD]1904[/TD][TD]21.2[/TD][TD]21.8[/TD][TD]20.6[/TD][TD]20.2[/TD][/TR]
[TR][TD]1905[/TD][TD]21.9[/TD][TD]22.5[/TD][TD]21.4[/TD][TD]21.1[/TD][/TR]
[TR][TD]1906[/TD][TD]19.7[/TD][TD]20.4[/TD][TD]19.5[/TD][TD]19.1[/TD][TD]21.1[/TD][/TR]
[TR][TD]1907[/TD][TD]21.3[/TD][TD]21.5[/TD][TD]21.9[/TD][TD]22.1[/TD][TD]21.1[/TD][TD]21.1[/TD][TD]20.6[/TD][TD]20.7[/TD][TD]22.0[/TD][/TR]
[TR][TD]1908[/TD][TD]19.4[/TD][TD]21.5[/TD][TD]20.0[/TD][TD]22.2[/TD][TD]19.2[/TD][TD]21.2[/TD][TD]18.6[/TD][TD]20.7[/TD][TD]20.5[/TD][/TR]
[TR][TD]1909[/TD][TD]21.8[/TD][TD]21.3[/TD][TD]22.5[/TD][TD]21.9[/TD][TD]21.0[/TD][TD]21.0[/TD][TD]20.6[/TD][TD]20.5[/TD][TD]23.0[/TD][/TR]
[TR][TD]1910[/TD][TD]20.9[/TD][TD]21.5[/TD][TD]21.4[/TD][TD]22.1[/TD][TD]20.6[/TD][TD]21.1[/TD][TD]20.0[/TD][TD]20.7[/TD][TD]21.7[/TD][/TR]
[TR][TD]1911[/TD][TD]22.6[/TD][TD]21.3[/TD][TD]23.3[/TD][TD]22.0[/TD][TD]22.1[/TD][TD]21.0[/TD][TD]21.6[/TD][TD]20.5[/TD][TD]23.6[/TD][/TR]
[TR][TD]1912[/TD][TD]20.2[/TD][TD]21.4[/TD][TD]20.9[/TD][TD]22.0[/TD][TD]20.0[/TD][TD]21.0[/TD][TD]19.6[/TD][TD]20.5[/TD][TD]21.8[/TD][/TR]
[TR][TD]1913[/TD][TD]20.0[/TD][TD]21.1[/TD][TD]20.5[/TD][TD]21.8[/TD][TD]19.6[/TD][TD]20.8[/TD][TD]19.3[/TD][TD]20.3[/TD][TD]21.5[/TD][/TR]
[TR][TD]1914[/TD][TD]22.5[/TD][TD]20.9[/TD][TD]23.1[/TD][TD]21.5[/TD][TD]22.1[/TD][TD]20.5[/TD][TD]21.6[/TD][TD]20.1[/TD][TD]23.7[/TD][/TR]
[TR][TD]1915[/TD][TD]22.7[/TD][TD]21.0[/TD][TD]23.3[/TD][TD]21.7[/TD][TD]22.4[/TD][TD]20.7[/TD][TD]21.9[/TD][TD]20.2[/TD][TD]23.8[/TD][/TR]
[TR][TD]1916[/TD][TD]23.7[/TD][TD]21.1[/TD][TD]24.7[/TD][TD]21.7[/TD][TD]23.1[/TD][TD]20.8[/TD][TD]22.7[/TD][TD]20.3[/TD][TD]24.6[/TD][TD]22.3[/TD][/TR]
[TR][TD]1917[/TD][TD]22.0[/TD][TD]21.5[/TD][TD]22.6[/TD][TD]22.2[/TD][TD]21.6[/TD][TD]21.1[/TD][TD]21.3[/TD][TD]20.7[/TD][TD]23.2[/TD][TD]22.6[/TD][/TR]
[TR][TD]1918[/TD][TD]22.6[/TD][TD]21.6[/TD][TD]23.4[/TD][TD]22.2[/TD][TD]22.0[/TD][TD]21.2[/TD][TD]21.4[/TD][TD]20.7[/TD][TD]23.7[/TD][TD]22.7[/TD][/TR]
[TR][TD]1919[/TD][TD]22.7[/TD][TD]21.9[/TD][TD]23.3[/TD][TD]22.6[/TD][TD]22.2[/TD][TD]21.5[/TD][TD]21.5[/TD][TD]21.0[/TD][TD]23.5[/TD][TD]23.1[/TD][/TR]
[TR][TD]1920[/TD][TD]21.4[/TD][TD]22.0[/TD][TD]22.2[/TD][TD]22.7[/TD][TD]21.0[/TD][TD]21.6[/TD][TD]20.6[/TD][TD]21.1[/TD][TD]22.7[/TD][TD]23.1[/TD][/TR]
[TR][TD]1921[/TD][TD]21.3[/TD][TD]22.0[/TD][TD]22.0[/TD][TD]22.7[/TD][TD]20.9[/TD][TD]21.6[/TD][TD]20.6[/TD][TD]21.2[/TD][TD]22.8[/TD][TD]23.2[/TD][/TR]
[TR][TD]1922[/TD][TD]23.4[/TD][TD]21.9[/TD][TD]24.3[/TD][TD]22.6[/TD][TD]22.7[/TD][TD]21.5[/TD][TD]22.3[/TD][TD]21.1[/TD][TD]24.4[/TD][TD]23.1[/TD][/TR]
[TR][TD]1923[/TD][TD]23.4[/TD][TD]22.2[/TD][TD]-[/TD][TD]22.9[/TD][TD]22.8[/TD][TD]21.8[/TD][TD]22.3[/TD][TD]21.3[/TD][TD]24.0[/TD][TD]23.4[/TD][/TR]
[TR][TD]1924[/TD][TD]21.8[/TD][TD]22.6[/TD][TD]22.0[/TD][TD]23.2[/TD][TD]21.0[/TD][TD]22.1[/TD][TD]20.4[/TD][TD]21.6[/TD][TD]22.5[/TD][TD]23.6[/TD][/TR]
[TR][TD]1925[/TD][TD]22.9[/TD][TD]22.5[/TD][TD]22.9[/TD][TD]23.1[/TD][TD]22.1[/TD][TD]22.0[/TD][TD]21.8[/TD][TD]21.5[/TD][TD]23.1[/TD][TD]23.5[/TD][/TR]
[TR][TD]1926[/TD][TD]23.2[/TD][TD]22.5[/TD][TD]23.4[/TD][TD]23.0[/TD][TD]22.3[/TD][TD]21.9[/TD][TD]21.8[/TD][TD]21.5[/TD][TD]23.2[/TD][TD]23.5[/TD][/TR]
[TR][TD]1927[/TD][TD]21.2[/TD][TD]22.5[/TD][TD]21.3[/TD][TD]22.9[/TD][TD]20.5[/TD][TD]21.9[/TD][TD]20.0[/TD][TD]21.4[/TD][TD]21.7[/TD][TD]23.3[/TD][/TR]
[TR][TD]1928[/TD][TD]23.9[/TD][TD]22.4[/TD][TD]23.4[/TD][TD]22.8[/TD][TD]23.2[/TD][TD]21.8[/TD][TD]22.9[/TD][TD]21.3[/TD][TD]24.0[/TD][TD]23.2[/TD][/TR]
[TR][TD]1929[/TD][TD]20.5[/TD][TD]22.5[/TD][TD]20.3[/TD][TD]22.8[/TD][TD]19.8[/TD][TD]21.9[/TD][TD]19.3[/TD][TD]21.4[/TD][TD]21.0[/TD][TD]23.2[/TD][/TR]
[TR][TD]1930[/TD][TD]21.5[/TD][TD]22.3[/TD][TD]21.1[/TD][TD]22.4[/TD][TD]20.4[/TD][TD]21.6[/TD][TD]20.0[/TD][TD]21.2[/TD][TD]21.7[/TD][TD]22.9[/TD][/TR]
[TR][TD]1931[/TD][TD]22.5[/TD][TD]22.3[/TD][TD]22.1[/TD][TD]22.3[/TD][TD]21.6[/TD][TD]21.6[/TD][TD]21.3[/TD][TD]21.1[/TD][TD]22.6[/TD][TD]22.8[/TD][/TR]
[TR][TD]1932[/TD][TD]21.8[/TD][TD]22.4[/TD][TD]21.4[/TD][TD]22.3[/TD][TD]21.1[/TD][TD]21.6[/TD][TD]20.7[/TD][TD]21.2[/TD][TD]21.8[/TD][TD]22.8[/TD][/TR]
[TR][TD]1933[/TD][TD]23.1[/TD][TD]22.3[/TD][TD]22.5[/TD][TD]22.0[/TD][TD]21.9[/TD][TD]21.5[/TD][TD]21.3[/TD][TD]21.1[/TD][TD]22.8[/TD][TD]22.6[/TD][/TR]
[TR][TD]1934[/TD][TD]21.6[/TD][TD]22.2[/TD][TD]21.3[/TD][TD]22.0[/TD][TD]20.6[/TD][TD]21.4[/TD][TD]20.3[/TD][TD]21.0[/TD][TD]22.0[/TD][TD]22.4[/TD][/TR]
[TR][TD]1935[/TD][TD]20.8[/TD][TD]22.2[/TD][TD]20.6[/TD][TD]22.0[/TD][TD]20.0[/TD][TD]21.4[/TD][TD]19.8[/TD][TD]20.9[/TD][TD]21.1[/TD][TD]22.4[/TD][/TR]
[TR][TD]1936[/TD][TD]24.2[/TD][TD]22.0[/TD][TD]23.6[/TD][TD]21.7[/TD][TD]23.2[/TD][TD]21.1[/TD][TD]22.7[/TD][TD]20.7[/TD][TD]23.9[/TD][TD]22.2[/TD][/TR]
[TR][TD]1937[/TD][TD]22.7[/TD][TD]22.1[/TD][TD]22.2[/TD][TD]21.8[/TD][TD]21.4[/TD][TD]21.2[/TD][TD]21.0[/TD][TD]20.8[/TD][TD]22.6[/TD][TD]22.3[/TD][/TR]
[TR][TD]1938[/TD][TD]22.4[/TD][TD]22.3[/TD][TD]22.0[/TD][TD]21.9[/TD][TD]21.3[/TD][TD]21.3[/TD][TD]20.8[/TD][TD]20.9[/TD][TD]22.3[/TD][TD]22.4[/TD][/TR]
[TR][TD]1939[/TD][TD]23.7[/TD][TD]22.1[/TD][TD]23.4[/TD][TD]21.7[/TD][TD]22.7[/TD][TD]21.1[/TD][TD]22.3[/TD][TD]20.7[/TD][TD]23.2[/TD][TD]22.2[/TD][/TR]
[TR][TD]1940[/TD][TD]21.7[/TD][TD]22.4[/TD][TD]21.2[/TD][TD]22.0[/TD][TD]20.7[/TD][TD]21.4[/TD][TD]20.5[/TD][TD]21.0[/TD][TD]21.5[/TD][TD]22.4[/TD][/TR]
[TR][TD]1941[/TD][TD]20.6[/TD][TD]22.5[/TD][TD]20.3[/TD][TD]22.0[/TD][TD]19.8[/TD][TD]21.5[/TD][TD]19.5[/TD][TD]21.1[/TD][TD]21.4[/TD][TD]22.4[/TD][/TR]
[TR][TD]1942[/TD][TD]24.9[/TD][TD]22.3[/TD][TD]24.4[/TD][TD]21.9[/TD][TD]23.2[/TD][TD]21.3[/TD][TD]22.7[/TD][TD]20.9[/TD][TD]24.4[/TD][TD]22.3[/TD][/TR]
[TR][TD]1943[/TD][TD]24.4[/TD][TD]22.6[/TD][TD]24.0[/TD][TD]22.2[/TD][TD]22.9[/TD][TD]21.5[/TD][TD]22.4[/TD][TD]21.1[/TD][TD]24.5[/TD][TD]22.5[/TD][/TR]
[TR][TD]1944[/TD][TD]23.2[/TD][TD]22.7[/TD][TD]22.6[/TD][TD]22.3[/TD][TD]21.7[/TD][TD]21.6[/TD][TD]21.3[/TD][TD]21.2[/TD][TD]23.0[/TD][TD]22.7[/TD][/TR]
[TR][TD]1945[/TD][TD]22.4[/TD][TD]22.9[/TD][TD]22.2[/TD][TD]22.4[/TD][TD]21.1[/TD][TD]21.7[/TD][TD]20.8[/TD][TD]21.3[/TD][TD]22.3[/TD][TD]22.8[/TD][/TR]
[TR][TD]1946[/TD][TD]23.1[/TD][TD]23.0[/TD][TD]22.5[/TD][TD]22.6[/TD][TD]21.5[/TD][TD]21.8[/TD][TD]20.8[/TD][TD]21.4[/TD][TD]23.1[/TD][TD]22.9[/TD][/TR]
[TR][TD]1947[/TD][TD]22.9[/TD][TD]22.9[/TD][TD]22.6[/TD][TD]22.5[/TD][TD]21.5[/TD][TD]21.6[/TD][TD]21.1[/TD][TD]21.2[/TD][TD]23.6[/TD][TD]22.8[/TD][/TR]
[TR][TD]1948[/TD][TD]23.8[/TD][TD]22.9[/TD][TD]23.3[/TD][TD]22.5[/TD][TD]22.3[/TD][TD]21.6[/TD][TD]21.7[/TD][TD]21.2[/TD][TD]23.4[/TD][TD]22.9[/TD][/TR]
[TR][TD]1949[/TD][TD]22.4[/TD][TD]23.1[/TD][TD]22.0[/TD][TD]22.7[/TD][TD]21.3[/TD][TD]21.7[/TD][TD]20.9[/TD][TD]21.3[/TD][TD]22.3[/TD][TD]23.0[/TD][/TR]
[TR][TD]1950[/TD][TD]23.8[/TD][TD]22.9[/TD][TD]23.4[/TD][TD]22.5[/TD][TD]22.7[/TD][TD]21.6[/TD][TD]22.2[/TD][TD]21.2[/TD][TD]23.8[/TD][TD]23.0[/TD][/TR]
[TR][TD]1951[/TD][TD]20.7[/TD][TD]23.2[/TD][TD]20.7[/TD][TD]22.7[/TD][TD]19.6[/TD][TD]21.8[/TD][TD]19.1[/TD][TD]21.3[/TD][TD]21.2[/TD][TD]23.2[/TD][/TR]
[TR][TD]1952[/TD][TD]22.7[/TD][TD]23.2[/TD][TD]22.6[/TD][TD]22.8[/TD][TD]21.6[/TD][TD]21.8[/TD][TD]21.2[/TD][TD]21.3[/TD][TD]23.2[/TD][TD]23.2[/TD][/TR]
[TR][TD]1953[/TD][TD]22.2[/TD][TD]22.9[/TD][TD]21.9[/TD][TD]22.6[/TD][TD]21.2[/TD][TD]21.6[/TD][TD]20.9[/TD][TD]21.2[/TD][TD]22.9[/TD][TD]23.0[/TD][/TR]
[TR][TD]1954[/TD][TD]24.6[/TD][TD]22.7[/TD][TD]24.1[/TD][TD]22.4[/TD][TD]23.4[/TD][TD]21.5[/TD][TD]22.9[/TD][TD]21.0[/TD][TD]24.2[/TD][TD]22.9[/TD][/TR]
[TR][TD]1955[/TD][TD]22.3[/TD][TD]22.9[/TD][TD]21.9[/TD][TD]22.5[/TD][TD]21.1[/TD][TD]21.6[/TD][TD]20.7[/TD][TD]21.2[/TD][TD]22.7[/TD][TD]23.0[/TD][/TR]
[TR][TD]1956[/TD][TD]22.7[/TD][TD]22.9[/TD][TD]22.4[/TD][TD]22.5[/TD][TD]21.8[/TD][TD]21.6[/TD][TD]21.5[/TD][TD]21.2[/TD][TD]22.7[/TD][TD]23.0[/TD][/TR]
[TR][TD]1957[/TD][TD]20.8[/TD][TD]22.8[/TD][TD]20.4[/TD][TD]22.5[/TD][TD]19.8[/TD][TD]21.7[/TD][TD]19.4[/TD][TD]21.2[/TD][TD]21.1[/TD][TD]23.0[/TD][/TR]
[TR][TD]1958[/TD][TD]23.2[/TD][TD]22.6[/TD][TD]22.8[/TD][TD]22.3[/TD][TD]22.2[/TD][TD]21.5[/TD][TD]21.8[/TD][TD]21.1[/TD][TD]23.1[/TD][TD]22.8[/TD][/TR]
[TR][TD]1959[/TD][TD]24.1[/TD][TD]22.5[/TD][TD]23.6[/TD][TD]22.2[/TD][TD]22.9[/TD][TD]21.5[/TD][TD]22.3[/TD][TD]21.1[/TD][TD]23.9[/TD][TD]22.7[/TD][/TR]
[TR][TD]1960[/TD][TD]23.6[/TD][TD]22.7[/TD][TD]23.5[/TD][TD]22.4[/TD][TD]22.3[/TD][TD]21.6[/TD][TD]21.8[/TD][TD]21.2[/TD][TD]23.6[/TD][TD]22.9[/TD][/TR]
[TR][TD]1961[/TD][TD]25.3[/TD][TD]22.7[/TD][TD]24.9[/TD][TD]22.4[/TD][TD]23.9[/TD][TD]21.6[/TD][TD]23.5[/TD][TD]21.2[/TD][TD]24.6[/TD][TD]22.9[/TD][/TR]
[TR][TD]1962[/TD][TD]24.5[/TD][TD]23.2[/TD][TD]24.3[/TD][TD]22.8[/TD][TD]22.8[/TD][TD]22.0[/TD][TD]22.2[/TD][TD]21.6[/TD][TD]23.9[/TD][TD]23.2[/TD][/TR]
[TR][TD]1963[/TD][TD]21.4[/TD][TD]23.3[/TD][TD]21.0[/TD][TD]23.0[/TD][TD]20.1[/TD][TD]22.1[/TD][TD]20.0[/TD][TD]21.7[/TD][TD]21.2[/TD][TD]23.3[/TD][/TR]
[TR][TD]1964[/TD][TD]22.3[/TD][TD]23.3[/TD][TD]22.2[/TD][TD]22.9[/TD][TD]21.2[/TD][TD]22.0[/TD][TD]20.7[/TD][TD]21.6[/TD][TD]22.7[/TD][TD]23.1[/TD][/TR]
[TR][TD]1965[/TD][TD]22.2[/TD][TD]23.0[/TD][TD]22.0[/TD][TD]22.7[/TD][TD]21.2[/TD][TD]21.8[/TD][TD]20.8[/TD][TD]21.4[/TD][TD]22.2[/TD][TD]23.0[/TD][/TR]
[TR][TD]1966[/TD][TD]23.2[/TD][TD]23.0[/TD][TD]22.8[/TD][TD]22.7[/TD][TD]22.1[/TD][TD]21.8[/TD][TD]21.3[/TD][TD]21.4[/TD][TD]23.3[/TD][TD]22.9[/TD][/TR]
[TR][TD]1967[/TD][TD]22.6[/TD][TD]23.1[/TD][TD]22.3[/TD][TD]22.8[/TD][TD]21.6[/TD][TD]21.9[/TD][TD]21.3[/TD][TD]21.4[/TD][TD]22.9[/TD][TD]23.0[/TD][/TR]
[TR][TD]1968[/TD][TD]21.9[/TD][TD]23.2[/TD][TD]21.4[/TD][TD]22.9[/TD][TD]21.0[/TD][TD]22.0[/TD][TD]20.7[/TD][TD]21.6[/TD][TD]21.6[/TD][TD]23.1[/TD][/TR]
[TR][TD]1969[/TD][TD]22.8[/TD][TD]23.1[/TD][TD]22.4[/TD][TD]22.8[/TD][TD]21.5[/TD][TD]21.9[/TD][TD]21.1[/TD][TD]21.5[/TD][TD]22.4[/TD][TD]23.0[/TD][/TR]
[TR][TD]1970[/TD][TD]24.0[/TD][TD]23.0[/TD][TD]23.3[/TD][TD]22.7[/TD][TD]22.3[/TD][TD]21.8[/TD][TD]21.9[/TD][TD]21.3[/TD][TD]23.5[/TD][TD]22.8[/TD][/TR]
[TR][TD]1971[/TD][TD]21.1[/TD][TD]23.0[/TD][TD]21.3[/TD][TD]22.7[/TD][TD]20.5[/TD][TD]21.8[/TD][TD]19.8[/TD][TD]21.4[/TD][TD]21.5[/TD][TD]22.8[/TD][/TR]
[TR][TD]1972[/TD][TD]23.1[/TD][TD]22.6[/TD][TD]23.1[/TD][TD]22.3[/TD][TD]22.0[/TD][TD]21.4[/TD][TD]21.4[/TD][TD]21.0[/TD][TD]22.9[/TD][TD]22.5[/TD][/TR]
[TR][TD]1973[/TD][TD]23.2[/TD][TD]22.5[/TD][TD]22.7[/TD][TD]22.2[/TD][TD]22.0[/TD][TD]21.4[/TD][TD]21.2[/TD][TD]20.9[/TD][TD]22.4[/TD][TD]22.4[/TD][/TR]
[TR][TD]1974[/TD][TD]22.8[/TD][TD]22.6[/TD][TD]22.2[/TD][TD]22.4[/TD][TD]21.3[/TD][TD]21.5[/TD][TD]20.6[/TD][TD]21.0[/TD][TD]21.9[/TD][TD]22.5[/TD][/TR]
[TR][TD]1975[/TD][TD]25.2[/TD][TD]22.7[/TD][TD]24.7[/TD][TD]22.4[/TD][TD]23.8[/TD][TD]21.6[/TD][TD]23.7[/TD][TD]21.0[/TD][TD]23.7[/TD][TD]22.5[/TD][/TR]
[TR][TD]1976[/TD][TD]22.0[/TD][TD]23.0[/TD][TD]21.7[/TD][TD]22.6[/TD][TD]20.7[/TD][TD]21.8[/TD][TD]20.5[/TD][TD]21.3[/TD][TD]21.8[/TD][TD]22.6[/TD][/TR]
[TR][TD]1977[/TD][TD]24.3[/TD][TD]22.9[/TD][TD]23.7[/TD][TD]22.5[/TD][TD]23.0[/TD][TD]21.7[/TD][TD]22.6[/TD][TD]21.2[/TD][TD]23.4[/TD][TD]22.5[/TD][/TR]
[TR][TD]1978[/TD][TD]22.2[/TD][TD]23.0[/TD][TD]21.6[/TD][TD]22.7[/TD][TD]20.7[/TD][TD]21.8[/TD][TD]20.7[/TD][TD]21.4[/TD][TD]22.2[/TD][TD]22.5[/TD][/TR]
[TR][TD]1979[/TD][TD]24.1[/TD][TD]23.1[/TD][TD]23.5[/TD][TD]22.7[/TD][TD]22.5[/TD][TD]21.8[/TD][TD]22.2[/TD][TD]21.4[/TD][TD]23.3[/TD][TD]22.6[/TD][/TR]
[TR][TD]1980[/TD][TD]23.0[/TD][TD]23.2[/TD][TD]22.5[/TD][TD]22.8[/TD][TD]21.7[/TD][TD]21.9[/TD][TD]21.0[/TD][TD]21.5[/TD][TD]22.4[/TD][TD]22.7[/TD][/TR]
[TR][TD]1981[/TD][TD]21.8[/TD][TD]23.1[/TD][TD]21.5[/TD][TD]22.7[/TD][TD]20.7[/TD][TD]21.8[/TD][TD]20.5[/TD][TD]21.4[/TD][TD]21.3[/TD][TD]22.6[/TD][/TR]
[TR][TD]1982[/TD][TD]22.3[/TD][TD]23.2[/TD][TD]21.4[/TD][TD]22.7[/TD][TD]20.9[/TD][TD]21.8[/TD][TD]20.5[/TD][TD]21.4[/TD][TD]21.9[/TD][TD]22.5[/TD][/TR]
[TR][TD]1983[/TD][TD]23.1[/TD][TD]23.1[/TD][TD]22.2[/TD][TD]22.6[/TD][TD]21.9[/TD][TD]21.7[/TD][TD]21.4[/TD][TD]21.4[/TD][TD]22.4[/TD][TD]22.4[/TD][/TR]
[TR][TD]1984[/TD][TD]23.5[/TD][TD]23.1[/TD][TD]22.7[/TD][TD]22.5[/TD][TD]22.0[/TD][TD]21.7[/TD][TD]21.7[/TD][TD]21.4[/TD][TD]22.3[/TD][TD]22.4[/TD][/TR]
[TR][TD]1985[/TD][TD]23.1[/TD][TD]23.2[/TD][TD]22.5[/TD][TD]22.6[/TD][TD]22.1[/TD][TD]21.8[/TD][TD]21.7[/TD][TD]21.5[/TD][TD]22.4[/TD][TD]22.5[/TD][/TR]
[TR][TD]1986[/TD][TD]23.7[/TD][TD]22.9[/TD][TD]23.2[/TD][TD]22.3[/TD][TD]22.6[/TD][TD]21.6[/TD][TD]22.4[/TD][TD]21.3[/TD][TD]23.3[/TD][TD]22.3[/TD][/TR]
[TR][TD]1987[/TD][TD]23.3[/TD][TD]23.1[/TD][TD]22.8[/TD][TD]22.5[/TD][TD]22.1[/TD][TD]21.8[/TD][TD]21.7[/TD][TD]21.5[/TD][TD]22.4[/TD][TD]22.5[/TD][/TR]
[TR][TD]1988[/TD][TD]22.8[/TD][TD]23.0[/TD][TD]22.3[/TD][TD]22.4[/TD][TD]21.7[/TD][TD]21.7[/TD][TD]21.5[/TD][TD]21.4[/TD][TD]22.9[/TD][TD]22.4[/TD][/TR]
[TR][TD]1989[/TD][TD]25.2[/TD][TD]23.1[/TD][TD]24.6[/TD][TD]22.5[/TD][TD]23.9[/TD][TD]21.8[/TD][TD]23.1[/TD][TD]21.5[/TD][TD]24.2[/TD][TD]22.5[/TD][/TR]
[TR][TD]1990[/TD][TD]24.8[/TD][TD]23.2[/TD][TD]24.3[/TD][TD]22.6[/TD][TD]23.5[/TD][TD]22.0[/TD][TD]23.0[/TD][TD]21.6[/TD][TD]24.1[/TD][TD]22.6[/TD][/TR]
[TR][TD]1991[/TD][TD]23.9[/TD][TD]23.4[/TD][TD]23.4[/TD][TD]22.8[/TD][TD]22.9[/TD][TD]22.1[/TD][TD]22.7[/TD][TD]21.8[/TD][TD]23.5[/TD][TD]22.7[/TD][/TR]
[TR][TD]1992[/TD][TD]23.3[/TD][TD]23.6[/TD][TD]22.9[/TD][TD]22.9[/TD][TD]22.4[/TD][TD]22.4[/TD][TD]22.1[/TD][TD]22.0[/TD][TD]22.3[/TD][TD]22.9[/TD][/TR]
[TR][TD]1993[/TD][TD]22.9[/TD][TD]23.7[/TD][TD]22.3[/TD][TD]23.1[/TD][TD]21.4[/TD][TD]22.5[/TD][TD]21.1[/TD][TD]22.1[/TD][TD]22.3[/TD][TD]23.0[/TD][/TR]
[TR][TD]1994[/TD][TD]24.8[/TD][TD]23.7[/TD][TD]24.1[/TD][TD]23.1[/TD][TD]23.7[/TD][TD]22.5[/TD][TD]23.4[/TD][TD]22.1[/TD][TD]24.0[/TD][TD]23.0[/TD][/TR]
[TR][TD]1995[/TD][TD]23.7[/TD][TD]23.8[/TD][TD]23.1[/TD][TD]23.2[/TD][TD]22.3[/TD][TD]22.6[/TD][TD]21.7[/TD][TD]22.3[/TD][TD]22.3[/TD][TD]23.1[/TD][/TR]
[TR][TD]1996[/TD][TD]22.4[/TD][TD]23.8[/TD][TD]21.8[/TD][TD]23.3[/TD][TD]21.4[/TD][TD]22.7[/TD][TD]21.0[/TD][TD]22.3[/TD][TD]21.8[/TD][TD]23.1[/TD][/TR]
[TR][TD]1997[/TD][TD]22.9[/TD][TD]23.7[/TD][TD]22.5[/TD][TD]23.2[/TD][TD]21.8[/TD][TD]22.5[/TD][TD]21.4[/TD][TD]22.1[/TD][TD]22.8[/TD][TD]23.0[/TD][/TR]
[TR][TD]1998[/TD][TD]24.4[/TD][TD]23.7[/TD][TD]23.7[/TD][TD]23.1[/TD][TD]23.5[/TD][TD]22.5[/TD][TD]23.3[/TD][TD]22.1[/TD][TD]23.5[/TD][TD]23.0[/TD][/TR]
[TR][TD]1999[/TD][TD]26.2[/TD][TD]23.8[/TD][TD]25.6[/TD][TD]23.3[/TD][TD]25.0[/TD][TD]22.7[/TD][TD]24.4[/TD][TD]22.3[/TD][TD]25.0[/TD][TD]23.1[/TD][/TR]
[TR][TD]2000[/TD][TD]25.6[/TD][TD]23.9[/TD][TD]24.4[/TD][TD]23.4[/TD][TD]24.0[/TD][TD]22.8[/TD][TD]23.3[/TD][TD]22.4[/TD][TD]24.4[/TD][TD]23.2[/TD][/TR]
[TR][TD]2001[/TD][TD]23.2[/TD][TD]24.0[/TD][TD]22.6[/TD][TD]23.4[/TD][TD]22.2[/TD][TD]22.8[/TD][TD]21.9[/TD][TD]22.4[/TD][TD]22.4[/TD][TD]23.2[/TD][/TR]
[TR][TD]2002[/TD][TD]23.1[/TD][TD]23.9[/TD][TD]22.5[/TD][TD]23.3[/TD][TD]22.2[/TD][TD]22.8[/TD][TD]21.5[/TD][TD]22.4[/TD][TD]22.7[/TD][TD]23.1[/TD][/TR]
[TR][TD]2003[/TD][TD]24.2[/TD][TD]23.9[/TD][TD]23.7[/TD][TD]23.3[/TD][TD]23.3[/TD][TD]22.8[/TD][TD]22.8[/TD][TD]22.3[/TD][TD]23.2[/TD][TD]23.1[/TD][/TR]
[TR][TD]2004[/TD][TD]25.1[/TD][TD]24.1[/TD][TD]24.6[/TD][TD]23.4[/TD][TD]24.1[/TD][TD]22.9[/TD][TD]23.4[/TD][TD]22.5[/TD][TD]23.9[/TD][TD]23.2[/TD][/TR]
[TR][TD]2005[/TD][TD]24.7[/TD][TD]24.1[/TD][TD]24.1[/TD][TD]23.5[/TD][TD]24.1[/TD][TD]23.0[/TD][TD]23.6[/TD][TD]22.5[/TD][TD]23.9[/TD][TD]23.2[/TD][/TR]
[TR][TD]2006[/TD][TD]23.5[/TD][TD]24.2[/TD][TD]23.1[/TD][TD]23.6[/TD][TD]22.9[/TD][TD]23.2[/TD][TD]22.3[/TD][TD]22.7[/TD][TD]23.5[/TD][TD]23.4[/TD][/TR]
[TR][TD]2007[/TD][TD]25.2[/TD][TD]24.3[/TD][TD]24.5[/TD][TD]23.7[/TD][TD]24.4[/TD][TD]23.3[/TD][TD]24.1[/TD][TD]22.8[/TD][TD]23.8[/TD][TD]23.5[/TD][/TR]
[TR][TD]2008[/TD][TD]24.4[/TD][TD]24.5[/TD][TD]23.9[/TD][TD]23.9[/TD][TD]23.4[/TD][TD]23.6[/TD][TD]22.9[/TD][TD]23.1[/TD][TD]23.3[/TD][TD]23.6[/TD][/TR]
[TR][TD]2009[/TD][TD]23.0[/TD][TD]24.5[/TD][TD]22.6[/TD][TD]23.9[/TD][TD]22.4[/TD][TD]23.6[/TD][TD]22.0[/TD][TD]23.0[/TD][TD]22.0[/TD][TD]23.6[/TD][/TR]
[TR][TD]2010[/TD][TD]25.1[/TD][TD]24.2[/TD][TD]24.7[/TD][TD]23.6[/TD][TD]24.7[/TD][TD]23.3[/TD][TD]24.2[/TD][TD]22.8[/TD][TD]24.4[/TD][TD]23.3[/TD][/TR]
[TR][TD]2011[/TD][TD]25.1[/TD][TD]24.2[/TD][TD]24.9[/TD][TD]23.6[/TD][TD]24.2[/TD][TD]23.4[/TD][TD]23.9[/TD][TD]22.9[/TD][TD]24.7[/TD][TD]23.3[/TD][/TR]
[TR][TD]2012[/TD][TD]26.2[/TD][TD]24.3[/TD][TD]25.4[/TD][TD]23.9[/TD][TD]25.3[/TD][TD]23.6[/TD][TD]24.9[/TD][TD]23.1[/TD][TD]24.9[/TD][TD]23.5[/TD][/TR]
[TR][TD]2013[/TD][TD]25.2[/TD][TD]24.7[/TD][TD]24.5[/TD][TD]24.2[/TD][TD]23.6[/TD][TD]23.9[/TD][TD]23.3[/TD][TD]23.4[/TD][TD]23.9[/TD][TD]23.8[/TD][/TR]
[TR][TD]2014[/TD][TD]23.2[/TD][TD]24.8[/TD][TD]22.8[/TD][TD]24.2[/TD][TD]22.1[/TD][TD]23.9[/TD][TD]21.7[/TD][TD]23.5[/TD][TD]22.3[/TD][TD]23.8[/TD][/TR][/TBODY]

the trend lines make the situation more obvious. rural station small trend. large city large trend, medium city medium trend. even with expanded data Yokohama is still an outlier for unknown reasons, although it is closer to the open sea. it would be interesting to see the temperature range of the bay as it goes towards Tokyo. the case for a UHI effect seems fairly conclusive for this small area of Japan.

is that what you were trying to show me crick?

Google Maps
 
the Tokyo station appears to be in the middle of the city near the Imperial Palace. the Yokohama station is on a peninsula surrounded by water. could be an explanation for the different trends.
 

Forum List

Back
Top