otto105
Diamond Member
- Sep 11, 2017
- 34,180
- 10,887
- 1,315
1. You're self-impeaching yourself acknowledging the rate only SINCE the Industrial Revolution!At a rate of 0.1" per year.. With no noticeable ACCELERATION.. It's been this way since roughly the beginning of the Indust. Revolution.. No EVIDENCE that the caterwailing catastrophies on the horizon...
2.
3. And even your post/admission is a LIE.
It is accelerating, with 80% of the gain in the last 60 years.

You Dishonest clown.
You have a 3 digit IQ so You must know better after all these years/research.
I knew immeddiately it was.
`
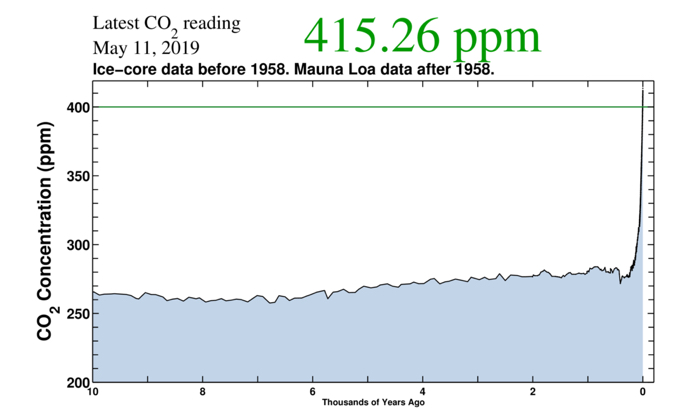
Before Mauna Loa --- ALL the ancient CO2 estimates came from tree rings, preserved vegetation and ice cores.. Literally HUNDREDS of studies that could only have the ability to produce mean readings and without resolution to SHOW variance over relatively short (less than a couple hundred years) periods of times.. So tacking on a MODERN INSTRUMENTATION record to these "long term averages" is NOT a science ploy any academic could get away with....
It's for "show" and to (as Al Gore put it) to "play on YOUR FEARS"....
And if you actually look at HIGH RESOLUTION Ice Core studies, NOT just ANY ice core study, you WILL SEE large amounts of variance and uncertainty.... Just reproducing the MEANS of these studies -- is fully dishonest...
Ancient proxies are tricky deals. And their uselfullness to draw comparisons of ancient CO2 to modern instruments is extremely iffy...
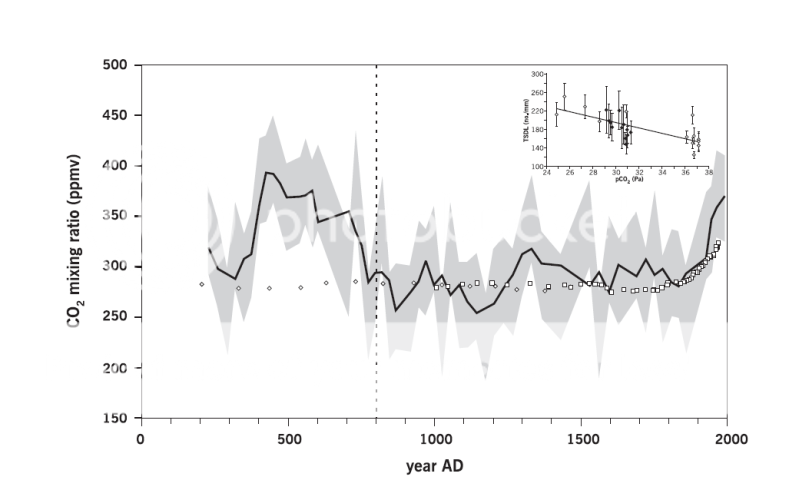
Fig. 14) Kouwenberg (2004) Figure 5.4: Reconstruction of paleo-atmospheric CO2 levels when stomatal frequency of fossil needles is converted to CO2 mixing ratios using the relation between CO2 and TSDL as quantified in the training set. Black line represents a 3 point running average based on 3–5 needles per depth. Grey area indicates the RMSE in the calibration. White diamonds are data measured in the Taylor Dome ice core (Indermühle et al., 1999); white squares CO2 measurements from the Law Dome ice-core (Etheridge et al., 1996). Inset: Training set of TSDL response of Tsuga heterophylla needles from the Pacific Northwest region to CO2 changes over the past century

A new stomatal proxy-based record of CO2 concentrations ([CO2]), based onBetula nana(dwarf birch)leaves from the Hässeldala Port sedimentary sequence in south-eastern Sweden, is presented. The recordis of high chronological resolution and spans most of Greenland Interstadial 1 (GI-1a to 1c, Allerød pollenzone), Greenland Stadial 1 (GS-1, Younger Dryas pollen zone) and the very beginning of the Holocene(Preboreal pollen zone). The record clearly demonstrates that i) [CO2] were significantly higher thanusually reported for the Last Termination and ii) the overall pattern of CO
2 evolution through the studiedtime period is fairly dynamic, with significant abrupt fluctuations in [CO2] when the climate moved frominterstadial to stadial state and vice versa
A new loss-on-ignition chemical record (used here as a proxyfor temperature) lends independent support to the Hässeldala Port [CO2] record. The large-amplitude fluctuations around the climate change transitions may indicate unstable climates and that “tipping-point” situations were involved in Last Termination climate evolution. The scenario presented here is in contrast to [CO2]records reconstructed from air bubbles trapped in ice, which indicate lower concen-trations and a gradual, linear increase of [CO2] through time. The prevalent explanation for the mainclimate forcer during the Last Termination being ocean circulation patterns needs to re-examined, and a larger role for atmospheric [CO2] considered

So be a good Doobie and go track down EXACTLY WHAT STUDY was used for the ancient data in the graph you provided..... As specially about ice core studies of past CO2 see E.G.
Ice cores and climate change - Publication - British Antarctic Survey
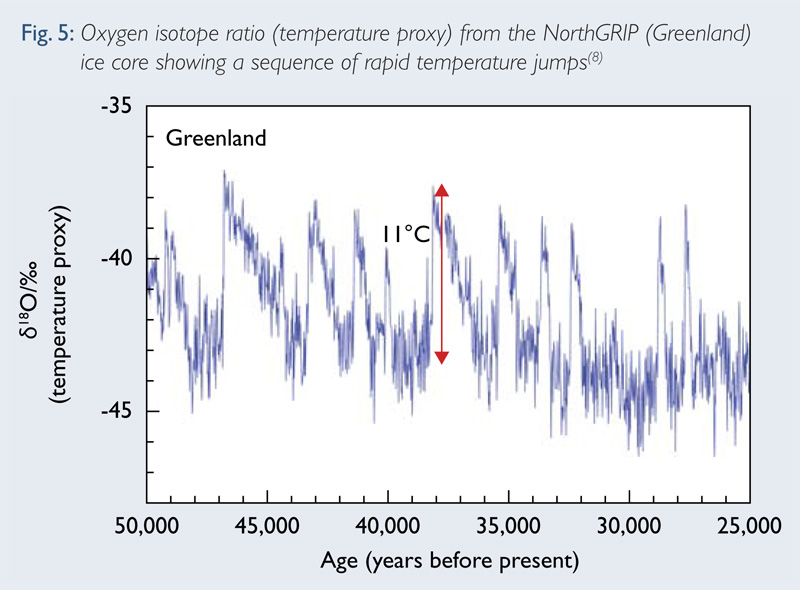
Abrupt climate changes
The climate changes described above were huge, but relatively gradual. However, ice cores have provided us with evidence that abrupt changes are also possible. During the last glacial period, Greenland experienced a sequence of very fast warmings (see Fig. 5 overleaf). The temperature increased by more than 10°C within 40 years. Other records show us that major changes in atmospheric circulation and climate were experienced all around the northern hemisphere. Antarctica and the Southern Ocean experienced a different pattern, consistent with the idea that these rapid jumps were caused by sudden changes in the transport of heat in the ocean. At this time, there was a huge ice sheet (the Laurentide) over northern North America. Freshwater delivered from the ice sheet to the North Atlantic was able periodically to disrupt the overturning of the ocean, causing the transport of tropical heat to the north to reduce and then suddenly increase again. While this mechanism cannot occur in the same way in today’s world, it does show us that, at least regionally, the climate is capable of extraordinary changes within a human lifetime – rapid switches we certainly want to avoid experiencing.
What you GET out of an ice core study depends on WHERE you took it (Greenland or Antarctica) and how many slices you took to study over the period of time you're studying...
So just dummying up a SCARY LOOKING one doesn't sway science in the least SpongeBob...
So, after this post there's a scientific organization ready to find that CW/CC is not happening due to man-made emissions...I mean you put the facts (as you cut and paste) them out there....
When can we expect that this organization will read your posts?