Old Rocks
Diamond Member
Sea Ice Volume
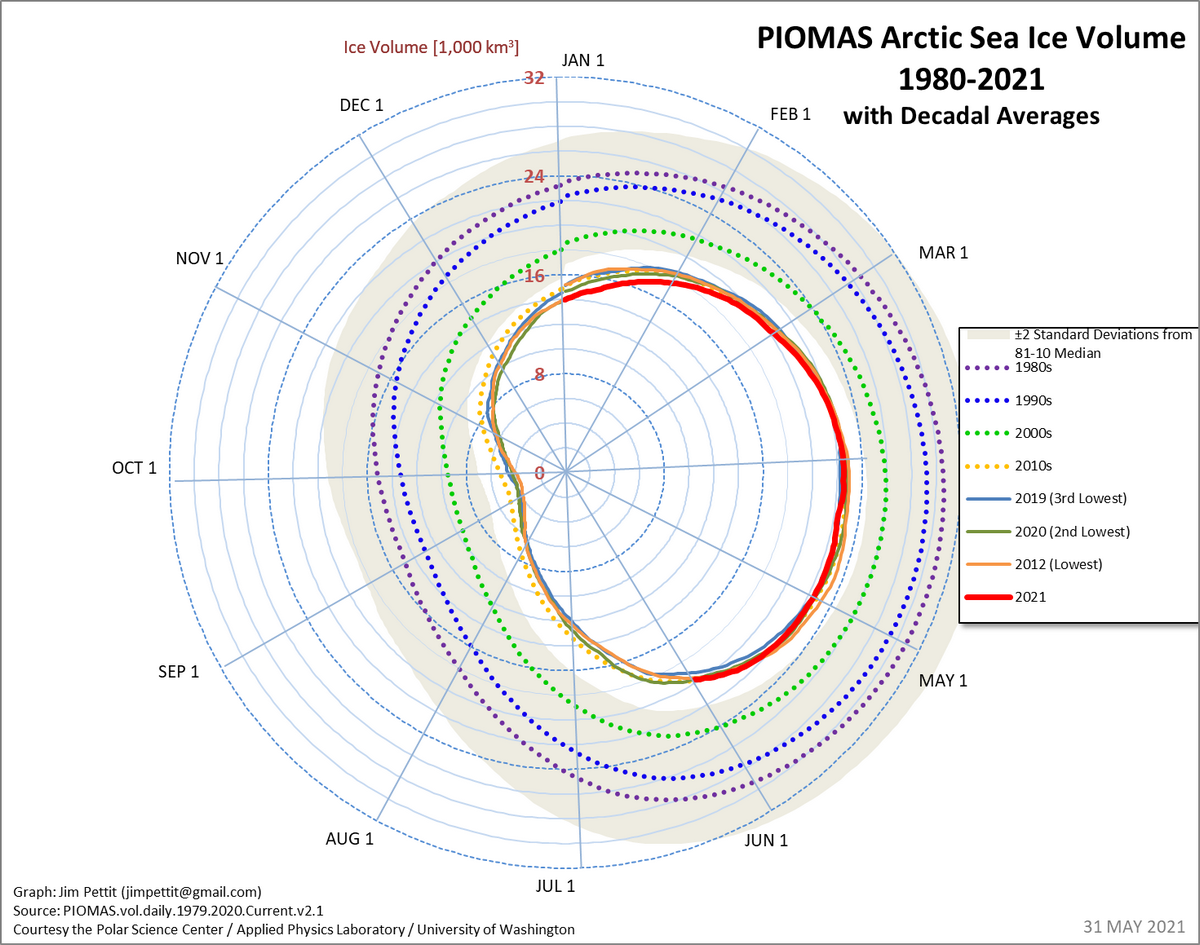
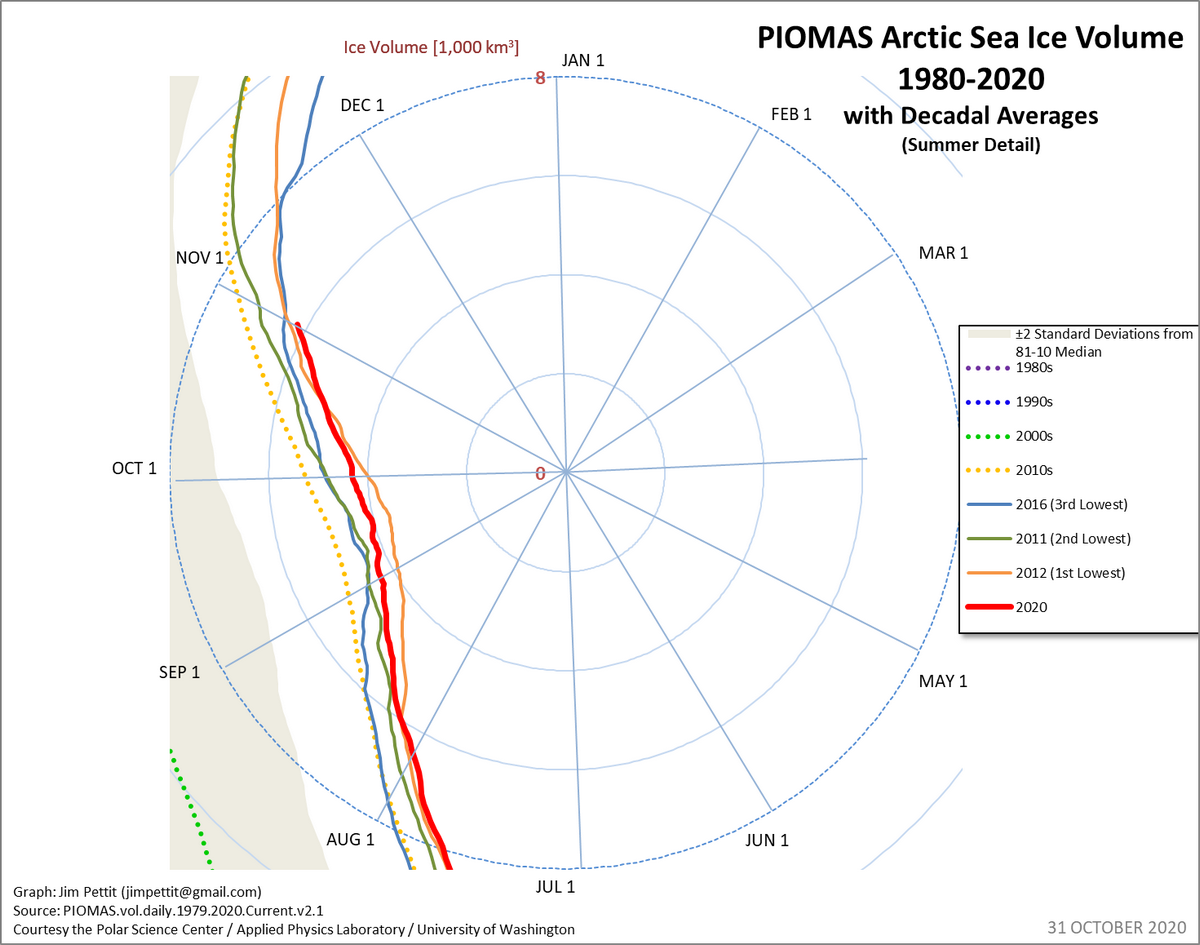
Arctic Sea Ice Volume 1979-2016 (aka "The Ice Volume Death Spiral")
This graph divides each calendar year into 12 "slices", one for each month. Arctic sea ice volume is plotted for each day of the year,
moving clockwise around the graph and taking one full year to complete a circuit. The volume of sea ice on a particular
day is represented by that plot's distance from the center of the graph; as shown by the vertical axis, more ice volume places the plot
farther from the center of the graph, while less ice volume places the plot closer to the center. Past years are represented by thin gray
lines, while decadal averages and the current year are thicker and color-coded as detailed in the legend.
Arctic Sea Ice Volume 1979-2016 (aka "The Ice Volume Death Spiral") - Zoom In
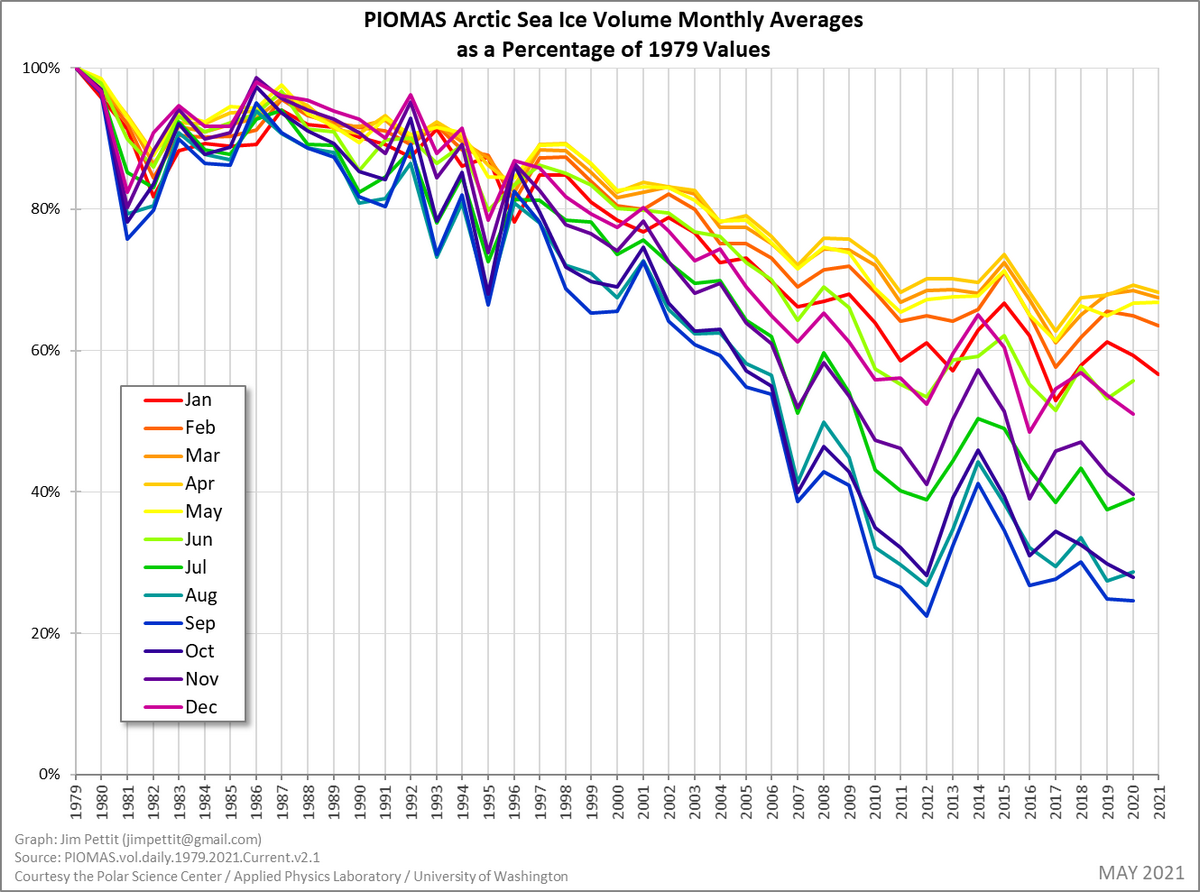
Arctic Sea Ice Volume Monthly Averages as a Percentage of 1979 Values
Sea Ice Volume - Pettit Climate Graphs
Yep, slight uptick for Jan and Feb, 2018.
Arctic Sea Ice Volume 1979-2016 (aka "The Ice Volume Death Spiral")
This graph divides each calendar year into 12 "slices", one for each month. Arctic sea ice volume is plotted for each day of the year,
moving clockwise around the graph and taking one full year to complete a circuit. The volume of sea ice on a particular
day is represented by that plot's distance from the center of the graph; as shown by the vertical axis, more ice volume places the plot
farther from the center of the graph, while less ice volume places the plot closer to the center. Past years are represented by thin gray
lines, while decadal averages and the current year are thicker and color-coded as detailed in the legend.
Arctic Sea Ice Volume 1979-2016 (aka "The Ice Volume Death Spiral") - Zoom In
Arctic Sea Ice Volume Monthly Averages as a Percentage of 1979 Values
Sea Ice Volume - Pettit Climate Graphs
Yep, slight uptick for Jan and Feb, 2018.