Mr. Shaman
Senior Member
- May 4, 2010
- 23,892
- 822
- 48
- Thread starter
- #61
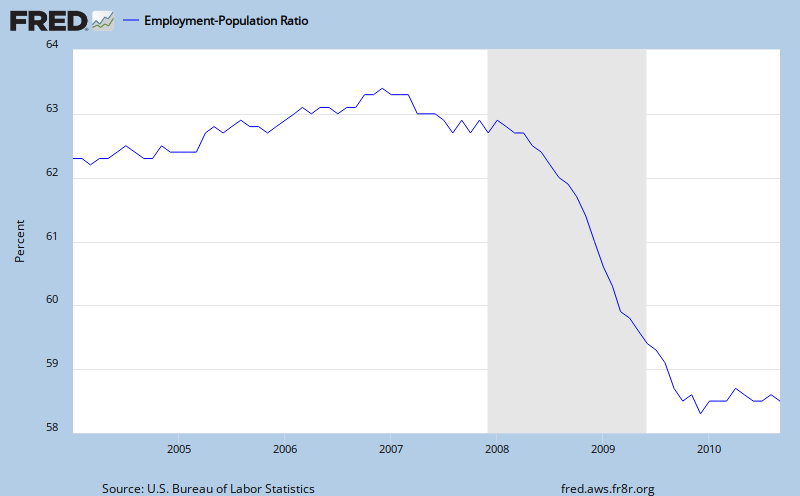
How does this record breaking performance record grab you? Dems were elected in 2006 to take over congress. They took office in January 2007. Look what happened to the workforce & the economy after they took over.
Fail.
1. Your x-axis only covers the range of 58-64, making the figure visually appear much more dramatic than it actually is.
2. Employment is a lagging indicator.
3. If you believe employment is inextricably linked to Congress in the short term, you have no concept of how the economy works.
1. The drop in employment & workforce are extremely dramatic no matter where you move the axis.
2. Employment is not always a lagging indicator! Employment plunged prior to the stock market.
3. The chart speaks to Democrats in Congress fucking up Jobs & the Economy.
Ooooooooooooooooooooooooooo.....no details.....again! 
(The first indication you have no idea what-the-Hell you're talkin'-about.
 )
)
(The first indication you have no idea what-the-Hell you're talkin'-about.


