
One of the reasons why I am bullish is because of this chart.
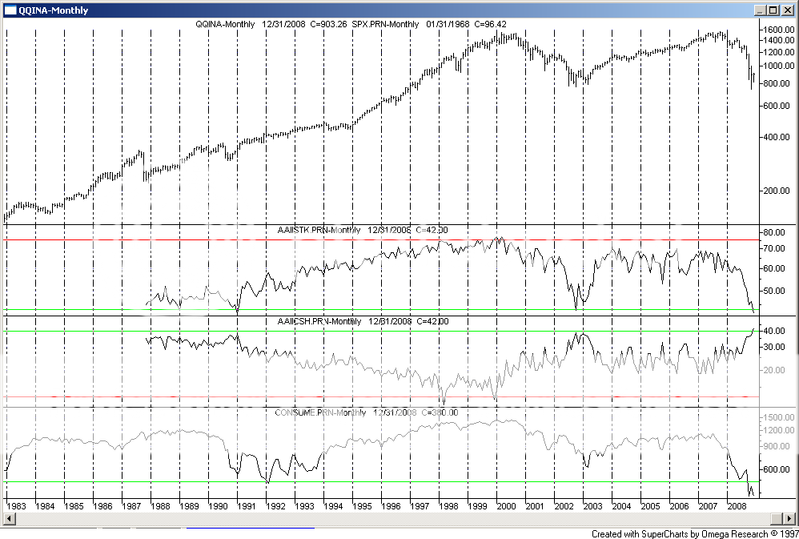
The first graph at the top is the S&P 500.
The second graph is the allocation by individuals towards stocks. Equities are currently at the lowest levels since data began being collected.
The third graph is the allocation by individuals towards cash. Cash is at the highest levels since data began being collected.
The bottom graph is consumer confidence. That is at an all-time low.
This does not mean the bottom is in. However, individual investors are usually a very good indicator of extreme sentiment which occur at turning points. In other words, at the top, individuals hold high levels of stocks and low levels of cash, and at bottoms they hold low levels of stocks and high levels of cash. We are currently at one of those times.
The following graph is of Tobin's Q. Tobin's Q is the ratio of market value to replacement value of a company's assets.

Tobin's Q is ~0.5, which is approaching multi-decade lows. As a reference, it hit 0.3 during the Depression.
Valuations are cheap relative to earnings.

Insiders have stopped selling their stock. They think their stocks are cheap too.

Returns for stock over the past decade have now plunged well below that of cash. Usually when that happens, stocks rise.

This does not mean the bottom is in, though the market has been taking a lot of body blows over the past two months and moving sideways instead of going down. There are still serious problems in the economy. However, if you have a long-term time horizon, stocks are attractive.
The first graph at the top is the S&P 500.
The second graph is the allocation by individuals towards stocks. Equities are currently at the lowest levels since data began being collected.
The third graph is the allocation by individuals towards cash. Cash is at the highest levels since data began being collected.
The bottom graph is consumer confidence. That is at an all-time low.
This does not mean the bottom is in. However, individual investors are usually a very good indicator of extreme sentiment which occur at turning points. In other words, at the top, individuals hold high levels of stocks and low levels of cash, and at bottoms they hold low levels of stocks and high levels of cash. We are currently at one of those times.
The following graph is of Tobin's Q. Tobin's Q is the ratio of market value to replacement value of a company's assets.
Tobin's Q is ~0.5, which is approaching multi-decade lows. As a reference, it hit 0.3 during the Depression.
Valuations are cheap relative to earnings.
Insiders have stopped selling their stock. They think their stocks are cheap too.
Returns for stock over the past decade have now plunged well below that of cash. Usually when that happens, stocks rise.
This does not mean the bottom is in, though the market has been taking a lot of body blows over the past two months and moving sideways instead of going down. There are still serious problems in the economy. However, if you have a long-term time horizon, stocks are attractive.
