July 2019 Was Not the Warmest on Record

Sunsettommy

Diamond Member
Mar 19, 2018
14,896
12,529
2,400
From Global Warming

July 2019 Was Not the Warmest on Record

August 2nd, 2019 by Roy W. Spencer, Ph. D.

EXCERPT:

July 2019 was probably the 4th warmest of the last 41 years. Global “reanalysis” datasets need to start being used for monitoring of global surface temperatures. [NOTE: It turns out that the WMO, which announced July 2019 as a near-record, relies upon the ERA5 reanalysis which apparently departs substantially from the CFSv2 reanalysis, making my proposed reliance on only reanalysis data for surface temperature monitoring also subject to considerable uncertainty].

and

"(1) The urban heat island (UHI) effect has caused a gradual warming of most land thermometer sites due to encroachment of buildings, parking lots, air conditioning units, vehicles, etc. These effects are localized, not indicative of most of the global land surface (which remains most rural), and not caused by increasing carbon dioxide in the atmosphere. Because UHI warming “looks like” global warming, it is difficult to remove from the data. In fact, NOAA’s efforts to make UHI-contaminated data look like rural data seems to have had the opposite effect. The best strategy would be to simply use only the best (most rural) sited thermometers. This is currently not done."

LINK

===

Here is his other blog post showing the UAH temperature data, that has a .09C COOLING from June:

UAH Global Temperature Update for July, 2019: +0.38 deg. C
August 1st, 2019 by Roy W. Spencer, Ph. D.

The Version 6.0 global average lower tropospheric temperature (LT) anomaly for July, 2019 was +0.38 deg. C, down from the June, 2019 value of +0.47 deg. C:

LINK
============================

I posted these two blog postings to show that the Media who gushes over heatwaves as if they were disasterous, when in reality were largely contaminated by UHI effects. Most of the "records" are being measured in the big cities where UHI is large and not accounted for. here is a Satellite map from space showing obvious UHI effects, where the big cities are hot and the surrounding region distinctly cooler.

PIA23148-16.jpg


LINK

Selected excerpt:

"ECOSTRESS mapped the surface, or ground temperature, of four European cities - Rome, Paris, Madrid and Milan - during the mornings of June 27 and June 28.In the images, hotter temperatures appear in red and cooler temperatures appear in blue. They show how the central core of each city is much hotter than the surrounding natural landscape due to the urban heat island effect - a result of urban surfaces storing and re-radiating heat throughout the day.

The fact that surface temperatures were as high as 77-86 degrees Fahrenheit (25-30 degrees Celsius) in the early morning indicates that much of the heat from previous days was stored by surfaces with high heat capacity (such as asphalt, concrete and water bodies) and unable to dissipate before the next day. The trapped heat resulted in even higher midday temperatures, in the high 40s (Celsius) in some places, as the heat wave continued."

=================================================

The media along with warmists needs to stop the lies, account for the UHI effects better and start using the RURAL temperate database sets instead, to help avoid most of the Urban heating effect on thermometers.
 
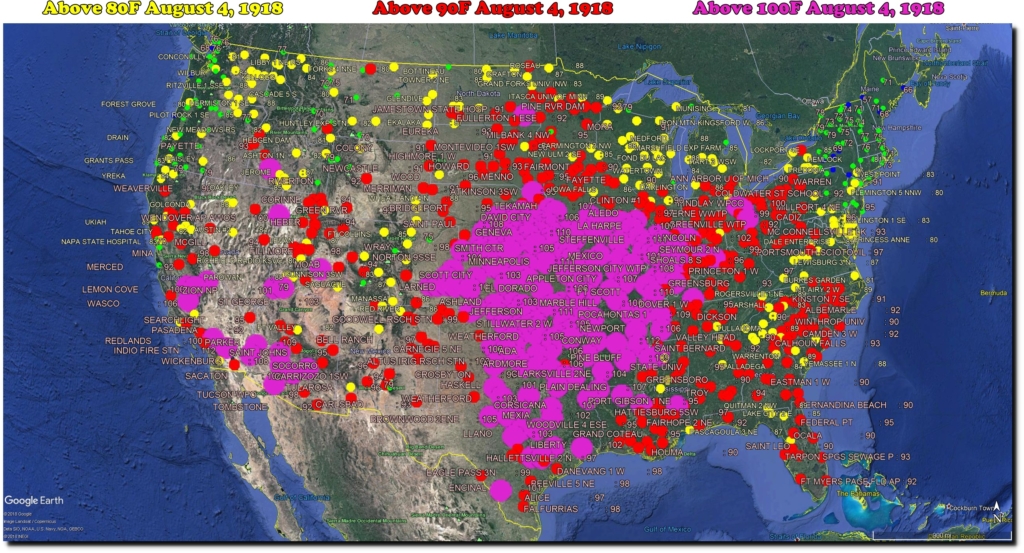
Here are some real heatwaves of the past we used to get, something that has become rare these days. The following from Real climate science:

"Temperatures topped out at 113 degrees at Clarinda, Iowa on August 4, 1918.


LINK

and,

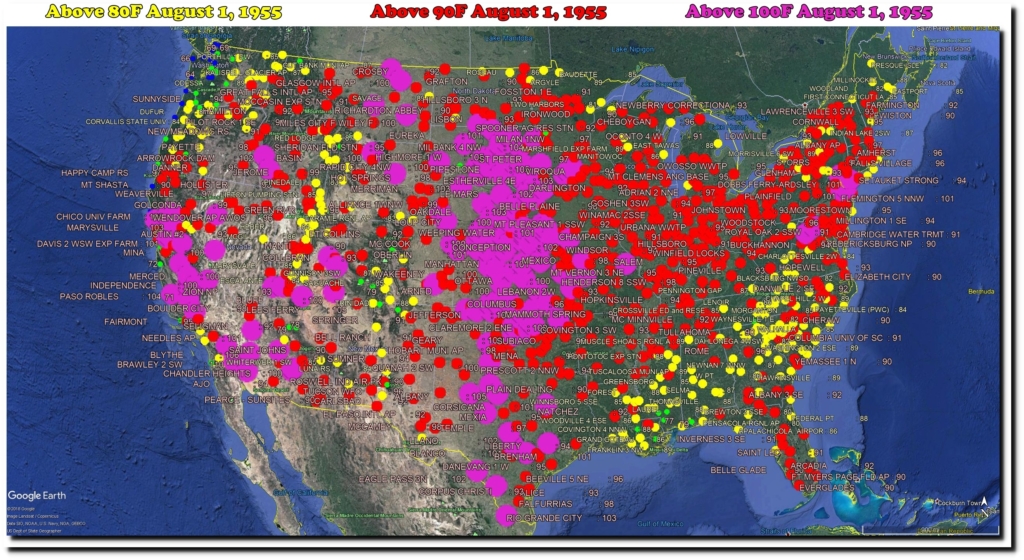
"On this date in 1955, every state was over 90 degrees (32C) and 20 states were over 100 degrees (38C.) Hot weather like that is incomprehensible now.


LINK

and,

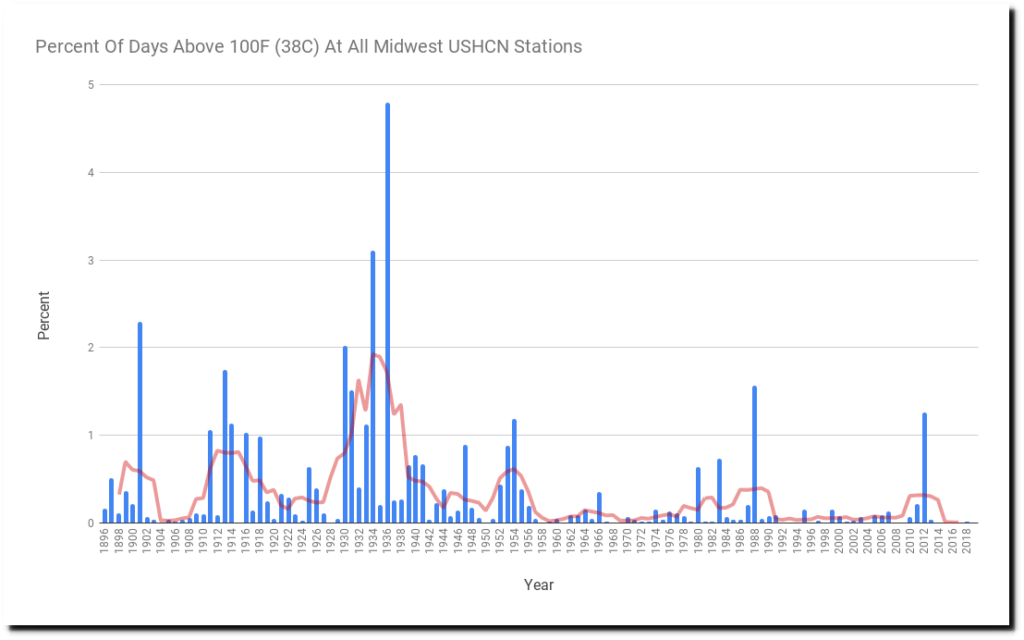
"This year (so far) is only the third year since 1895 to post no 100 degree temperatures in the Midwest. The other two were 1928 and 1992 (after the eruption of Mt. Pinatubo.) The likelihood of 100 degree weather has plummeted over the past century.


LINK

and,

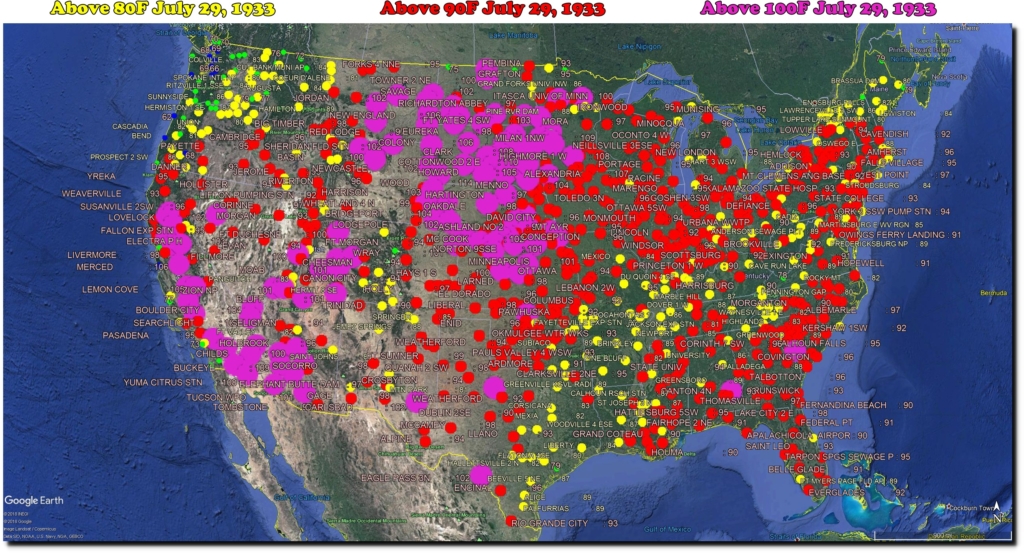
"On this date in 1933, it was 109 degrees at Milan Minnesota – which was 37 degrees warmer than today. Gann Valley, South Dakota was 115 degrees on that date – which was 36 degrees warmer than today.


Many more charts in the LINK

There are many more like this that used to be terrible heatwaves, now the heatwaves we get now are cooler and smaller in area, yet warmists who chronically ignore anything before the 1950, sees doom around every 95-100 degree days.
 
From Global Warming

July 2019 Was Not the Warmest on Record

August 2nd, 2019 by Roy W. Spencer, Ph. D.

EXCERPT:

July 2019 was probably the 4th warmest of the last 41 years. Global “reanalysis” datasets need to start being used for monitoring of global surface temperatures. [NOTE: It turns out that the WMO, which announced July 2019 as a near-record, relies upon the ERA5 reanalysis which apparently departs substantially from the CFSv2 reanalysis, making my proposed reliance on only reanalysis data for surface temperature monitoring also subject to considerable uncertainty].

and

"(1) The urban heat island (UHI) effect has caused a gradual warming of most land thermometer sites due to encroachment of buildings, parking lots, air conditioning units, vehicles, etc. These effects are localized, not indicative of most of the global land surface (which remains most rural), and not caused by increasing carbon dioxide in the atmosphere. Because UHI warming “looks like” global warming, it is difficult to remove from the data. In fact, NOAA’s efforts to make UHI-contaminated data look like rural data seems to have had the opposite effect. The best strategy would be to simply use only the best (most rural) sited thermometers. This is currently not done."

LINK

===

Here is his other blog post showing the UAH temperature data, that has a .09C COOLING from June:

UAH Global Temperature Update for July, 2019: +0.38 deg. C
August 1st, 2019 by Roy W. Spencer, Ph. D.

The Version 6.0 global average lower tropospheric temperature (LT) anomaly for July, 2019 was +0.38 deg. C, down from the June, 2019 value of +0.47 deg. C:

LINK
============================

I posted these two blog postings to show that the Media who gushes over heatwaves as if they were disasterous, when in reality were largely contaminated by UHI effects. Most of the "records" are being measured in the big cities where UHI is large and not accounted for. here is a Satellite map from space showing obvious UHI effects, where the big cities are hot and the surrounding region distinctly cooler.

View attachment 272576

LINK

Selected excerpt:

"ECOSTRESS mapped the surface, or ground temperature, of four European cities - Rome, Paris, Madrid and Milan - during the mornings of June 27 and June 28.In the images, hotter temperatures appear in red and cooler temperatures appear in blue. They show how the central core of each city is much hotter than the surrounding natural landscape due to the urban heat island effect - a result of urban surfaces storing and re-radiating heat throughout the day.

The fact that surface temperatures were as high as 77-86 degrees Fahrenheit (25-30 degrees Celsius) in the early morning indicates that much of the heat from previous days was stored by surfaces with high heat capacity (such as asphalt, concrete and water bodies) and unable to dissipate before the next day. The trapped heat resulted in even higher midday temperatures, in the high 40s (Celsius) in some places, as the heat wave continued."

=================================================

The media along with warmists needs to stop the lies, account for the UHI effects better and start using the RURAL temperate database sets instead, to help avoid most of the Urban heating effect on thermometers.
Very informative and right on target. This warming was regional and isolated, not global. This was purely a localized event and the high temps were due to land use change, not AGW. You put a nail right through the BS claims of the government alarmists...

Well Done!!!!
 
Well here comes North Americas cool down...

Regions 2 and 3 are dropping like a rock and 3-4 is following close behind.

nino3.png


nino2.png


nino3_4.png


We should be in negative numbers by later this month. Going cold right as winter is to set in..

sst_monthly.gif


The cold pool is enlarging off the west coast and will affect our winter with colder temps. Cooling at altitude is already at mid September levels across the Rockies and has already resulted in our first snow of the year on Aug 2.
 
I see that warmists are terrified of this thread, many have realized their overblown "hottest year on record" rhetoric was stale, boring and useless. They run on media soundbites, while failing to show how that supports the AGW narrative, it doesn't but warmists are not smart enough to know that.

:abgg2q.jpg:
 
Last edited:
Here are some real heatwaves of the past we used to get, something that has become rare these days. The following from Real climate science:

"Temperatures topped out at 113 degrees at Clarinda, Iowa on August 4, 1918.


LINK

and,

"On this date in 1955, every state was over 90 degrees (32C) and 20 states were over 100 degrees (38C.) Hot weather like that is incomprehensible now.


LINK

and,

"This year (so far) is only the third year since 1895 to post no 100 degree temperatures in the Midwest. The other two were 1928 and 1992 (after the eruption of Mt. Pinatubo.) The likelihood of 100 degree weather has plummeted over the past century.


LINK

and,

"On this date in 1933, it was 109 degrees at Milan Minnesota – which was 37 degrees warmer than today. Gann Valley, South Dakota was 115 degrees on that date – which was 36 degrees warmer than today.


Many more charts in the LINK

There are many more like this that used to be terrible heatwaves, now the heatwaves we get now are cooler and smaller in area, yet warmists who chronically ignore anything before the 1950, sees doom around every 95-100 degree days.

DENIER!!! DENIER!!! Your "Charts" are deniers and need to be adjusted downward
 
Well here comes North Americas cool down...

Regions 2 and 3 are dropping like a rock and 3-4 is following close behind.

nino3.png


nino2.png


nino3_4.png


We should be in negative numbers by later this month. Going cold right as winter is to set in..

sst_monthly.gif


The cold pool is enlarging off the west coast and will affect our winter with colder temps. Cooling at altitude is already at mid September levels across the Rockies and has already resulted in our first snow of the year on Aug 2.

Wait, the Warmers will post the deep ocean temperature data set from 1850 onward anytime now

Any

Time

Now

If they do bring up the ocean water data, it only hurts their AGW position since Sun is the dominant source of heating (about 99%) the waters up, CO2 doesn't warm up the water at all. Not only that El-Nino's events are the dominant cause for atmospheric warming, with CO2 effect way down the list of the "heat budget". Currently, El-Nino is fading away which is why July cooled almost .10C in a single month from June.

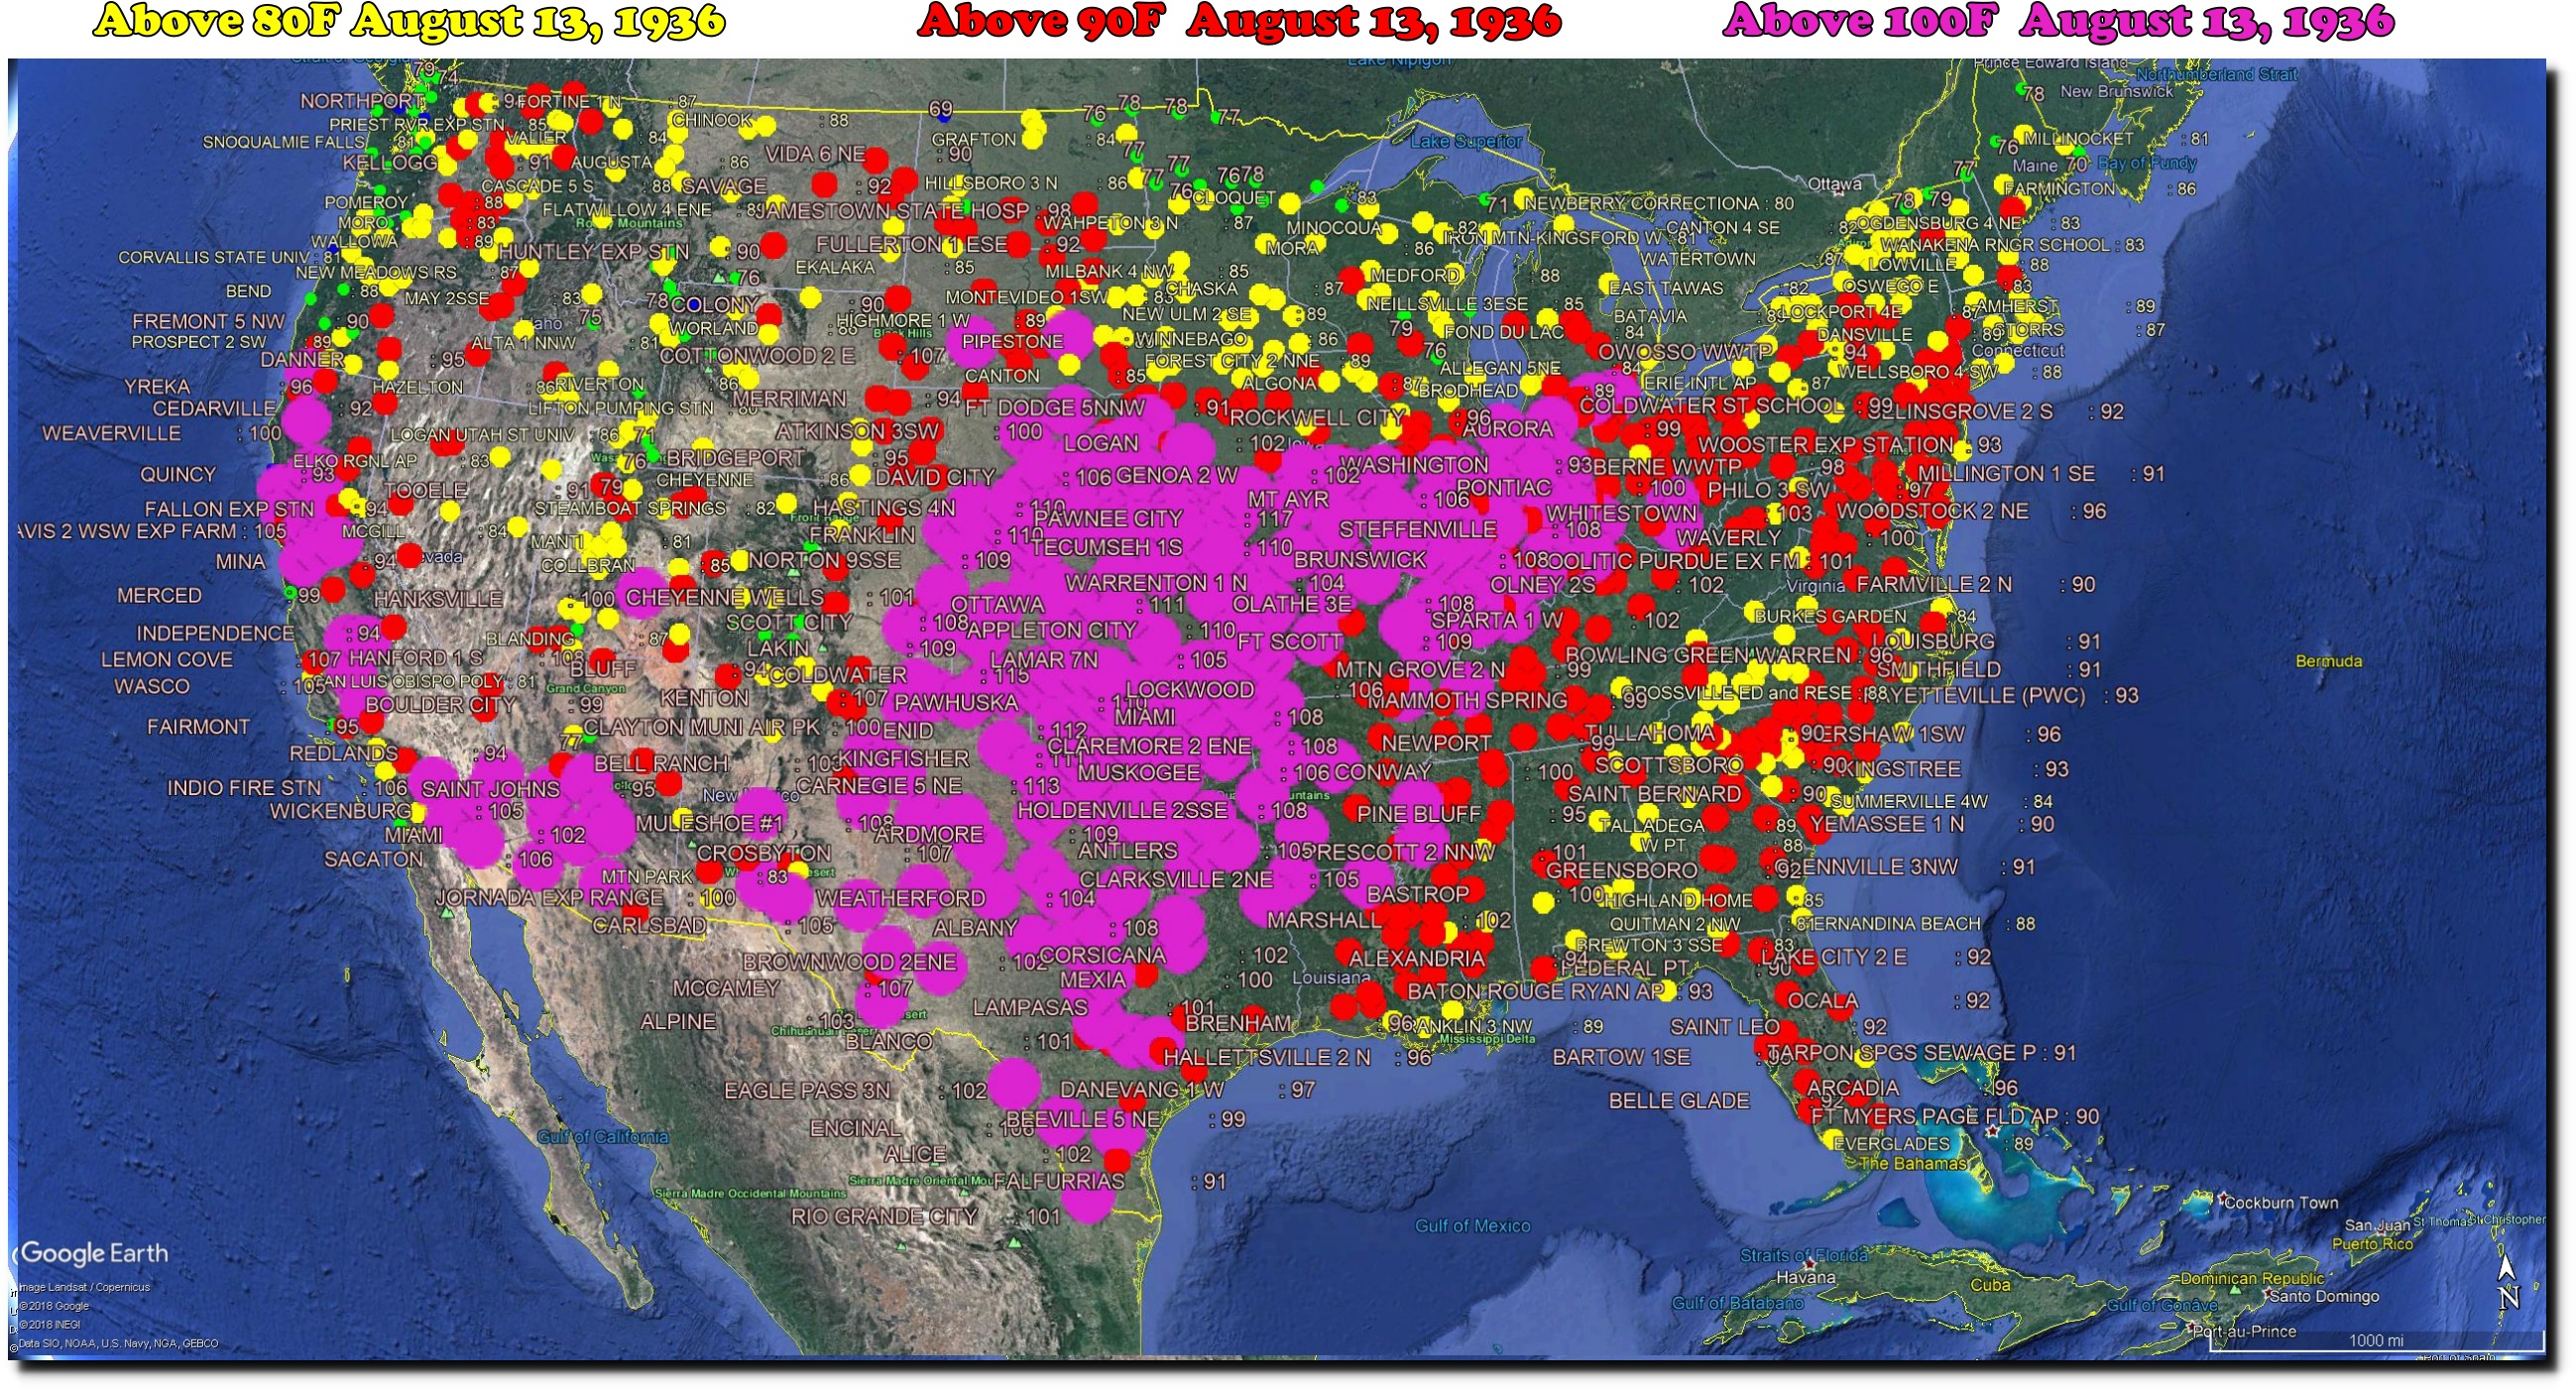
Meanwhile here is another heatwave we don't see in America anymore, look how widespread and hot it used to be:

US_08131936.jpg

LINK

Not even close to that yesterday.
 
Last edited:
LMAO. Historic temp records are not accurate. Cites them as fact when convenient. Satellite imagery of Arctic show polar cap is a wreck and near an all time low. Yet Billy Bob telling us planet is cooling down.
 
Nice willful ignorance admission. Not surprising when it comes to localized heating you'd think they add the state of the Artic to the joke.
 
LMAO. Historic temp records are not accurate. Cites them as fact when convenient. Satellite imagery of Arctic show polar cap is a wreck and near an all time low. Yet Billy Bob telling us planet is cooling down.
Please show us your observed empirical evidence to support your statement.. I'll Wait...
July 2019 was hottest month on record for the planet | National Oceanic and Atmospheric Administration

This is from NOAA, not some blog that's cherry-picking temps around the U.S. What part of GLOBAL don't the denialists understand?
That story was retracted... But hey, You wouldn't want that to be known...

July 2019 Was Not the Warmest on Record

And yes they are doubling down on the lie after adjusting the data sets...
 
Last edited:
Last edited:
And the Polar jet has decimated all hurricane formation..8/15/2019 and still not one named storm... National Hurricane Center
WRONG! There have been two named storms, Andrea and Barry 2019 Atlantic hurricane season - Wikipedia
Not according to NOAA..Wikipedia incorrectly names two tropical depressions that never made hurricane status... Now that's damn funny....
You just moved the goal posts. Suddenly "named storms" isn't good enough; now it's "hurricane".

Naming tropical depressions is a fine example of moving goalposts...and naming winter storms...when did tropical depressions and winter storms start getting names?
 
And the Polar jet has decimated all hurricane formation..8/15/2019 and still not one named storm... National Hurricane Center
WRONG! There have been two named storms, Andrea and Barry 2019 Atlantic hurricane season - Wikipedia
Not according to NOAA..Wikipedia incorrectly names two tropical depressions that never made hurricane status... Now that's damn funny....
You just moved the goal posts. Suddenly "named storms" isn't good enough; now it's "hurricane".
Naming tropical depressions is a fine example of moving goalposts...and naming winter storms...when did tropical depressions and winter storms start getting names?
You seem to have gotten some misinformation here. The first named storm, Andrea, was a tropical storm and the second, Barry, was a hurricane. Tropical depressions don't get named.
 

Forum List

Back
Top