- Thread starter
- #41
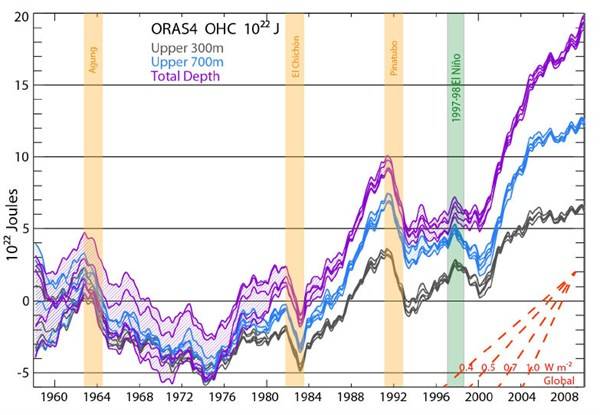
Polar Bear, have you ever read the text below? It's the abstract to the work by Balmaseda, Trenberth and Kalllen from which that graph of ocean temperatures comes.
The elusive nature of the post-2004 upper ocean warming has exposed uncertainties in the
oceansrole in the Earths energy budget and transient climate sensitivity. Here we present the
time evolution of the global ocean heat content for 1958 through 2009 from a new observationalbased reanalysis of the ocean. Volcanic eruptions and El Niño events are identified as sharp
cooling events punctuating a long-term ocean warming trend, while heating continues during the
recent upper-ocean-warming hiatus, but the heat is absorbed in the deeper ocean. In the last
decade, about 30% of the warming has occurred below 700m, contributing significantly to an
acceleration of the warming trend. The warming below 700m remains even when the Argo
observing system is withdrawn although the trends are reduced. Sensitivity experiments
illustrate that surface wind variability is largely responsible for the changing ocean heat vertical
distribution.
Up above, you showed us a pretty picture of lots and lots of ARGO buoys. What you didn't show us was their data. It would seem from the highlighted comment in the abstract, that the ARGO data shows the ocean is warming, even MORE strongly than this ORAS4 reanalysis.
Hmmmm. The warming is far less than was predicted by every climate model ever produced and, more importantly, is less than the instrument error of the ARGO system (which is around 0.1C)....so is there actually any warming? I mean really, if the instrument isn't capable of reading the increase then the only way that increase can show up is if SOMEONE PUTS IT THERE.
I wonder who that might be?????