I stumbled upon this old graph that compares the GISS US Temps produced in 06, 07, 08, 09, 10, and 2011.
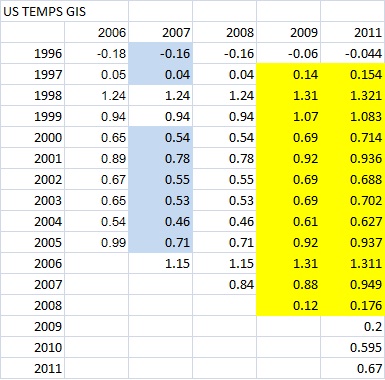
I havent looked at last year's numbers but I will post them. does anyone want to guess whether the temps have gone up or down? I think we all know that the numbers will have gone up but what do you think the over/under should be? a new version went in late '11 or early '12 so I am not sure if this graph already has the bump. 0.015C seems like a reasonable guess to me. anybody else want to make a guess? how about you warmers out there? do you think the adjustment to the 'adjustments' will be larger or smaller than 0.015C on average for the years covered?
a quick eyeball of the data seems to show a 0.08C rise over five years (but it did have a dip for McIntyre's discovery of the Y2K problem). that's over one and a half degrees per century! is it any wonder that skeptics are a bit leary of putting total faith in global warming numbers? and this is for the most measured, best measured area in the world, with a lower than average temperature increase!
so.....anybody want to make a guess?
edit- six years, there isnt any data presented for 2010.
Last edited:
") ) that sparsity is greatly relieved.
) that sparsity is greatly relieved.