What was the average temperature at the north pole on June 30th, 1918?Southern should be solid cold....Air temps are falling, not rising. this is late fall behavior.From NSIDC -- It's a late summer up in the Arctic this year.

Aren't we talking about the ARCTIC? You know -- Northern Hemi ^^^ Southern Hemi vvvvvv
Funny thing is, the northern hemisphere is acting the same way by being -6 deg F cooler than average along with polar lows decreasing in pressure (indicating strengthening) when the opposite should be happening this time of year.

Another Silly Billy stinky 'fact' straight from his ample ass. LOL Northern Hemisphere +0.4 warmer, Arctic, +0.3 warmer than average.
Navigation
Install the app
How to install the app on iOS
Follow along with the video below to see how to install our site as a web app on your home screen.

Note: This feature currently requires accessing the site using the built-in Safari browser.
More options
You are using an out of date browser. It may not display this or other websites correctly.
You should upgrade or use an alternative browser.
You should upgrade or use an alternative browser.
Holy crap!! Arctic ocean almost totally ice covered!!
- Thread starter skookerasbil
- Start date
Old Rocks
Diamond Member
Here are some quotes from the site that publishes that map;mage 2 of 6 (play slideshow) Download
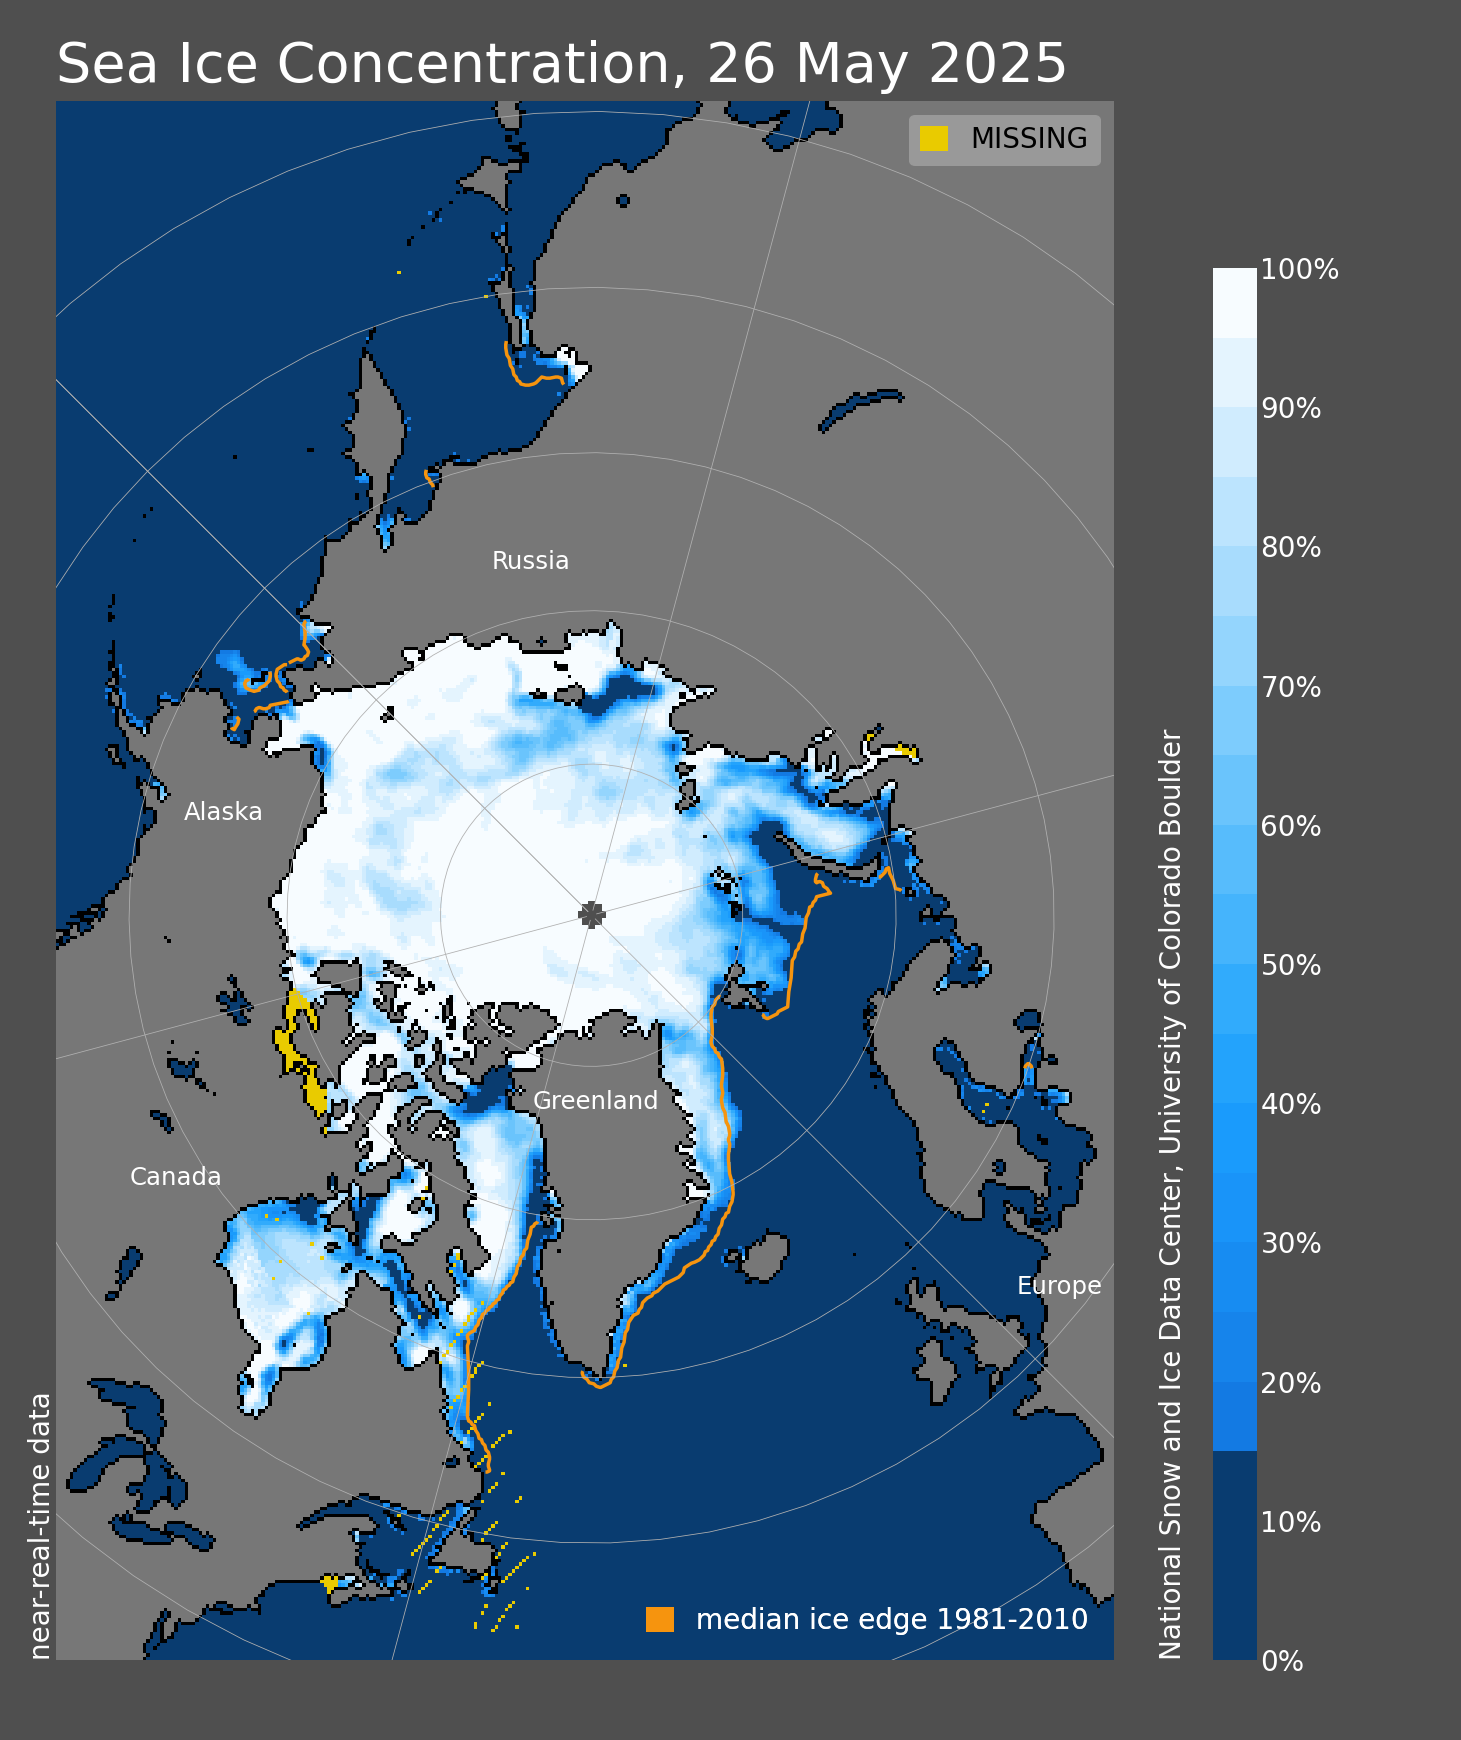
Arctic Sea Ice News and Analysis | Sea ice data updated daily with one-day lag
Looks like there is considerably less ice for this time of year than in most previous years.

Hey Rocks why isn't your Bullshit chart showing the ice?
Understanding the Arctic sea ice: Polar Portal
Global climate
The diminishing sea ice has the potential to further enhance global warming, change climate patterns and perhaps even influence global ocean circulation. It has been documented that the diminishing sea ice has created a feedback mechanism in the Arctic climate.
The sea is dark; the ice is white. That makes a big difference when it comes to reflecting sunlight. The dark sea absorbs heat while the ice reflects a much larger proportion of the sun’s energy (the “Albedo-effect”). So a smaller sea ice extent means more open, dark water, which results in more absorption of the sun’s energy in the seawater, and thus more warming of the seawater.
The warmer seawater raises the temperature of the air above, which means that ice formation will take place later in the year. And next year, when melting sets in, there is less ice and melting may happen faster, which means that the sea is open to absorb even more energy from the sun. And so on.
Scientists call it a positive feedback that enhances the changes even further. And this specific feedback has been documented in the Arctic. To what degree this will have effects outside the Arctic is still an open question.
Old Rocks
Diamond Member
More from that site;mage 2 of 6 (play slideshow) Download
Arctic Sea Ice News and Analysis | Sea ice data updated daily with one-day lag
Looks like there is considerably less ice for this time of year than in most previous years.
Hey Rocks why isn't your Bullshit chart showing the ice?
Sea Ice Thickness and Volume: Polar Portal
Two measures for sea ice
The sea ice in the Arctic has reacted noticeably to the rise in air and ocean temperatures: There is significantly less sea ice now compared to 30 years ago.
Scientists use two basic measures for sea ice: extent and thickness.
Extent: Since 1979 it has been possible to monitor sea ice by satellite. We now have more than 30 years of reliable information on the extent of the sea ice cover.
The data shows that the extent in the summer is 30% smaller than it was at the beginning of the 1980s. The extent during winter has diminished by about 10%. In September 2012, the ice extent set a new minimum record: it was the smallest measured since 1979. Compared to the average extent (1979-2000), the sea ice had diminished by 49%.
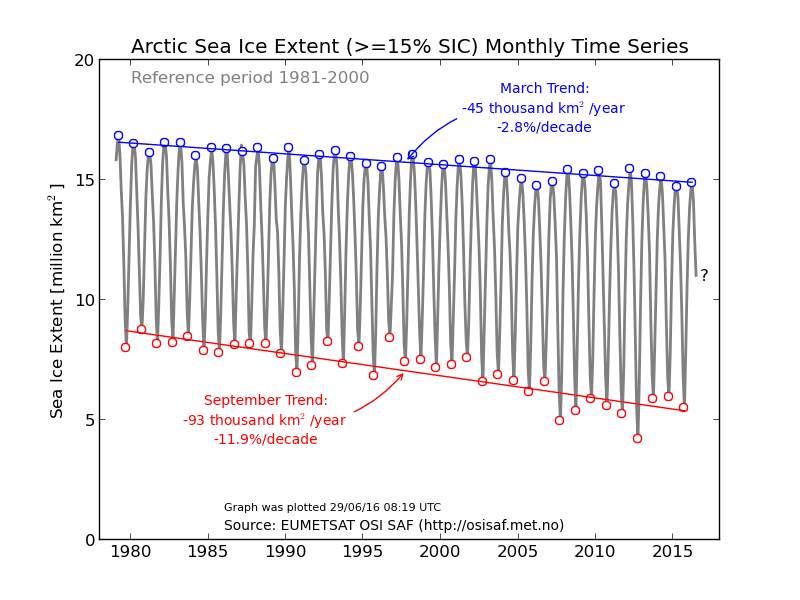
Figure 1. The development of the extent of the Arctic sea ice by the end of the summer (red line) and at the end of the winter season (blue line). Even though the variation from year to year is obvious, the trend is equally clear. <font color="red">We have improved the algorithms that calculate sea ice concentration and extent. On June 28, 2016, we updated the graphs of ice extent with new data of higher quality (read more <a href="Ocean and Ice Services | Danmarks Meteorologiske Institut" class="external-link-new-window" title="Opens external link in new window" data-htmlarea-external="1">here</a>).</font>
- May 20, 2009
- 144,256
- 66,560
- 2,330
Here are some quotes from the site that publishes that map;mage 2 of 6 (play slideshow) Download
Arctic Sea Ice News and Analysis | Sea ice data updated daily with one-day lag
Looks like there is considerably less ice for this time of year than in most previous years.
Hey Rocks why isn't your Bullshit chart showing the ice?
Understanding the Arctic sea ice: Polar Portal
Global climate
The diminishing sea ice has the potential to further enhance global warming, change climate patterns and perhaps even influence global ocean circulation. It has been documented that the diminishing sea ice has created a feedback mechanism in the Arctic climate.
The sea is dark; the ice is white. That makes a big difference when it comes to reflecting sunlight. The dark sea absorbs heat while the ice reflects a much larger proportion of the sun’s energy (the “Albedo-effect”). So a smaller sea ice extent means more open, dark water, which results in more absorption of the sun’s energy in the seawater, and thus more warming of the seawater.
The warmer seawater raises the temperature of the air above, which means that ice formation will take place later in the year. And next year, when melting sets in, there is less ice and melting may happen faster, which means that the sea is open to absorb even more energy from the sun. And so on.
Scientists call it a positive feedback that enhances the changes even further. And this specific feedback has been documented in the Arctic. To what degree this will have effects outside the Arctic is still an open question.
They seem to have a pre-existing bias against their being more ice at the Arctic
Old Rocks
Diamond Member
The site that the OP referred to completely lied about what the Danish research site says. But that is the norm for the deniers on this board. Without the lies, they would have nothing at all. The Polar Portal is in complete agreement with our researchers at NOAA and NSIDC.
Southern should be solid cold....Air temps are falling, not rising. this is late fall behavior.From NSIDC -- It's a late summer up in the Arctic this year.
Aren't we talking about the ARCTIC? You know -- Northern Hemi ^^^ Southern Hemi vvvvvv
Funny thing is, the northern hemisphere is acting the same way by being -6 deg F cooler than average along with polar lows decreasing in pressure (indicating strengthening) when the opposite should be happening this time of year.
Another Silly Billy stinky 'fact' straight from his ample ass. LOL Northern Hemisphere +0.4 warmer, Arctic, +0.3 warmer than average.
STILL pushing "Climate Reanalyzer" project? You do realize those are NOT temperature readings they are MODELED and "reanalyzed" readings based on "seeding" a sparse set" of initial conditions" into a model and letting grad students at Univ of Maine diddle the model knobs until the "colors" are scary enough.
I've compared the results in the past -- and they DRASTICALLY depart from reality on the ground. Just the NAME "reanalyzer" OUGHT to give a thinking person pause before sucking up this whole. But apparently, it doesn't slow you down a single microsecond.
- May 20, 2009
- 144,256
- 66,560
- 2,330
What was the average temperature at the north pole on June 30th, 1918?Southern should be solid cold....Air temps are falling, not rising. this is late fall behavior.From NSIDC -- It's a late summer up in the Arctic this year.
Aren't we talking about the ARCTIC? You know -- Northern Hemi ^^^ Southern Hemi vvvvvv
Funny thing is, the northern hemisphere is acting the same way by being -6 deg F cooler than average along with polar lows decreasing in pressure (indicating strengthening) when the opposite should be happening this time of year.
Another Silly Billy stinky 'fact' straight from his ample ass. LOL Northern Hemisphere +0.4 warmer, Arctic, +0.3 warmer than average.
24.87899F give or take 5 degrees
That's one topic the left BS about. What's your historical record? Uh, 1979 to today.What was the average temperature at the north pole on June 30th, 1918?Southern should be solid cold....Air temps are falling, not rising. this is late fall behavior.
Aren't we talking about the ARCTIC? You know -- Northern Hemi ^^^ Southern Hemi vvvvvv
Funny thing is, the northern hemisphere is acting the same way by being -6 deg F cooler than average along with polar lows decreasing in pressure (indicating strengthening) when the opposite should be happening this time of year.
Another Silly Billy stinky 'fact' straight from his ample ass. LOL Northern Hemisphere +0.4 warmer, Arctic, +0.3 warmer than average.
24.87899F give or take 5 degrees
The left hate science.
- May 20, 2009
- 144,256
- 66,560
- 2,330
That's one topic the left BS about. What's your historical record? Uh, 1979 to today.What was the average temperature at the north pole on June 30th, 1918?Southern should be solid cold....Aren't we talking about the ARCTIC? You know -- Northern Hemi ^^^ Southern Hemi vvvvvv
Funny thing is, the northern hemisphere is acting the same way by being -6 deg F cooler than average along with polar lows decreasing in pressure (indicating strengthening) when the opposite should be happening this time of year.
Another Silly Billy stinky 'fact' straight from his ample ass. LOL Northern Hemisphere +0.4 warmer, Arctic, +0.3 warmer than average.
24.87899F give or take 5 degrees
The left hate science.
But they're accurate to a tenth of a degree dating back to 1880 cuz stats, er, or something
Compared to the average extent (1979-2000), the sea ice had diminished by 49%.
Statements like that are blatant misrepresentations because it not rigidly specified. You could see that from the graph you posted. It uses the 11.9% SUMMER extent decadal decline rate to get the 49% since 1979. But the WINTER extent is less than a 1/5 of that. That's why you NORMALIZE year over year to get something like NSIDC plots.
At LEAST qualify the statement with "summer extent" and then we can chat about how ICE is worst proxy for reading temperature and temperatures effects on the planet.
SSDD
Gold Member
- Nov 6, 2012
- 16,672
- 1,966
- 280
More from that site;mage 2 of 6 (play slideshow) Download
Arctic Sea Ice News and Analysis | Sea ice data updated daily with one-day lag
Looks like there is considerably less ice for this time of year than in most previous years.
Hey Rocks why isn't your Bullshit chart showing the ice?
Sea Ice Thickness and Volume: Polar Portal
Two measures for sea ice
The sea ice in the Arctic has reacted noticeably to the rise in air and ocean temperatures: There is significantly less sea ice now compared to 30 years ago.
Scientists use two basic measures for sea ice: extent and thickness.
Extent: Since 1979 it has been possible to monitor sea ice by satellite. We now have more than 30 years of reliable information on the extent of the sea ice cover.
The data shows that the extent in the summer is 30% smaller than it was at the beginning of the 1980s. The extent during winter has diminished by about 10%. In September 2012, the ice extent set a new minimum record: it was the smallest measured since 1979. Compared to the average extent (1979-2000), the sea ice had diminished by 49%.
Figure 1. The development of the extent of the Arctic sea ice by the end of the summer (red line) and at the end of the winter season (blue line). Even though the variation from year to year is obvious, the trend is equally clear. <font color="red">We have improved the algorithms that calculate sea ice concentration and extent. On June 28, 2016, we updated the graphs of ice extent with new data of higher quality (read more <a href="Ocean and Ice Services | Danmarks Meteorologiske Institut" class="external-link-new-window" title="Opens external link in new window" data-htmlarea-external="1">here</a>).</font>
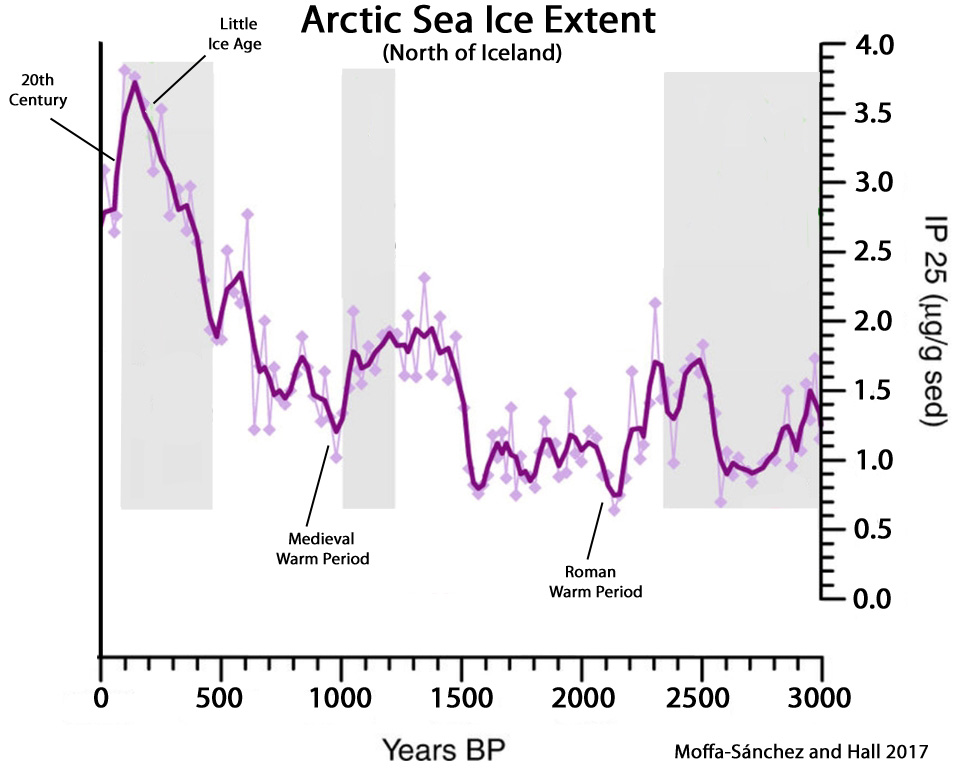
Why don't you put up a graph that covers a bit more time? Afraid if you show people a bigger picture they will laugh you off the board? Here is what the ice has looked like for the past 3000 years...you are a hysterical handwaving ninny rocks...
Old Rocks
Diamond Member
That was a quote from Polar Portal, which is a site of these people;Compared to the average extent (1979-2000), the sea ice had diminished by 49%.
Statements like that are blatant misrepresentations because it not rigidly specified. You could see that from the graph you posted. It uses the 11.9% SUMMER extent decadal decline rate to get the 49% since 1979. But the WINTER extent is less than a 1/5 of that. That's why you NORMALIZE year over year to get something like NSIDC plots.
At LEAST qualify the statement with "summer extent" and then we can chat about how ICE is worst proxy for reading temperature and temperatures effects on the planet.
© 2018 - DMI, DTU, GEUS.

Funding for creating and running this website is provided with support from Dancea (Danish Cooperation for Environment in the Arctic) under the Danish Ministry for Energy, Utilities and Climate.
DMI, GEUS and DTU are responsible for the content of the site.
Old Rocks
Diamond Member
I put up a sat
I put up a graph that covers the period of satellite observation. Please give me the name of the satellites used in that study. LOLMore from that site;mage 2 of 6 (play slideshow) Download
Arctic Sea Ice News and Analysis | Sea ice data updated daily with one-day lag
Looks like there is considerably less ice for this time of year than in most previous years.
Hey Rocks why isn't your Bullshit chart showing the ice?
Sea Ice Thickness and Volume: Polar Portal
Two measures for sea ice
The sea ice in the Arctic has reacted noticeably to the rise in air and ocean temperatures: There is significantly less sea ice now compared to 30 years ago.
Scientists use two basic measures for sea ice: extent and thickness.
Extent: Since 1979 it has been possible to monitor sea ice by satellite. We now have more than 30 years of reliable information on the extent of the sea ice cover.
The data shows that the extent in the summer is 30% smaller than it was at the beginning of the 1980s. The extent during winter has diminished by about 10%. In September 2012, the ice extent set a new minimum record: it was the smallest measured since 1979. Compared to the average extent (1979-2000), the sea ice had diminished by 49%.
Figure 1. The development of the extent of the Arctic sea ice by the end of the summer (red line) and at the end of the winter season (blue line). Even though the variation from year to year is obvious, the trend is equally clear. <font color="red">We have improved the algorithms that calculate sea ice concentration and extent. On June 28, 2016, we updated the graphs of ice extent with new data of higher quality (read more <a href="Ocean and Ice Services | Danmarks Meteorologiske Institut" class="external-link-new-window" title="Opens external link in new window" data-htmlarea-external="1">here</a>).</font>
Why don't you put up a graph that covers a bit more time? Afraid if you show people a bigger picture they will laugh you off the board? Here is what the ice has looked like for the past 3000 years...you are a hysterical handwaving ninny rocks...
- Thread starter
- #34
I put up a sat
I put up a graph that covers the period of satellite observation. Please give me the name of the satellites used in that study. LOLMore from that site;mage 2 of 6 (play slideshow) Download
Arctic Sea Ice News and Analysis | Sea ice data updated daily with one-day lag
Looks like there is considerably less ice for this time of year than in most previous years.
Hey Rocks why isn't your Bullshit chart showing the ice?
Sea Ice Thickness and Volume: Polar Portal
Two measures for sea ice
The sea ice in the Arctic has reacted noticeably to the rise in air and ocean temperatures: There is significantly less sea ice now compared to 30 years ago.
Scientists use two basic measures for sea ice: extent and thickness.
Extent: Since 1979 it has been possible to monitor sea ice by satellite. We now have more than 30 years of reliable information on the extent of the sea ice cover.
The data shows that the extent in the summer is 30% smaller than it was at the beginning of the 1980s. The extent during winter has diminished by about 10%. In September 2012, the ice extent set a new minimum record: it was the smallest measured since 1979. Compared to the average extent (1979-2000), the sea ice had diminished by 49%.
Figure 1. The development of the extent of the Arctic sea ice by the end of the summer (red line) and at the end of the winter season (blue line). Even though the variation from year to year is obvious, the trend is equally clear. <font color="red">We have improved the algorithms that calculate sea ice concentration and extent. On June 28, 2016, we updated the graphs of ice extent with new data of higher quality (read more <a href="Ocean and Ice Services | Danmarks Meteorologiske Institut" class="external-link-new-window" title="Opens external link in new window" data-htmlarea-external="1">here</a>).</font>
Why don't you put up a graph that covers a bit more time? Afraid if you show people a bigger picture they will laugh you off the board? Here is what the ice has looked like for the past 3000 years...you are a hysterical handwaving ninny rocks...
Graphs are ghey and as we know, frequently fake in this forum. Images now....images dont lie and show that as of right now, the Arctic is COMPLETELY covered with ice.
Only a climate crusader would see a pic of Kim Kardasian's boobs and throw up a graph displaying how unimpressive they are!!

I mean c'mon now....who can take these people seriously?

Last edited:
That was a quote from Polar Portal, which is a site of these people;Compared to the average extent (1979-2000), the sea ice had diminished by 49%.
Statements like that are blatant misrepresentations because it not rigidly specified. You could see that from the graph you posted. It uses the 11.9% SUMMER extent decadal decline rate to get the 49% since 1979. But the WINTER extent is less than a 1/5 of that. That's why you NORMALIZE year over year to get something like NSIDC plots.
At LEAST qualify the statement with "summer extent" and then we can chat about how ICE is worst proxy for reading temperature and temperatures effects on the planet.
© 2018 - DMI, DTU, GEUS.

Funding for creating and running this website is provided with support from Dancea (Danish Cooperation for Environment in the Arctic) under the Danish Ministry for Energy, Utilities and Climate.
DMI, GEUS and DTU are responsible for the content of the site.
That's fine. Everyone makes honest mistakes if it's not an actual published paper. But too often, it seems to be done to grossly exaggerate. Yes, the Arctic sea ice is in decline. Does not mean the end of the world is at hand. Just means it crossed a threshhold some long time back where fall and spring days can bring short periods of stunted growth or melt. And those periods will result in bad years for sea ice. Even IF it's as short as a couple days above 0DegC.
1979 was relative HIGH for sea ice. And that is part of the problem here. Don't even have quite 40 years yet of reliable accounting.
Old Rocks
Diamond Member
LOL Some of those days of above 0 C have been in the dead of winter;

The sun won’t rise at the North Pole until March 20, and it’s normally close to the coldest time of year, but an extraordinary and possibly historic thaw swelled over the tip of the planet this weekend. Analyses show that the temperature warmed to the melting point as an enormous storm pumped an intense pulse of heat through the Greenland Sea.
Temperatures may have soared as high as 35 degrees Fahrenheit (2 degrees Celsius) at the pole, according to the U.S. Global Forecast System model. While there are no direct measurements of temperature there, Zack Labe, a climate scientist working on his PhD at the University of California at Irvine, confirmed that several independent analyses showed “it was very close to freezing,” which is more than 50 degrees (30 degrees Celsius) above normal.
North Pole surges above freezing in the dead of winter, stunning scientists
Above 0 C in February is a bit more than a couple of days above zero. It is indicative of a much larger change.
Fort Fun Indiana
Diamond Member
- Mar 10, 2017
- 92,485
- 58,121
- 2,645
Well, of course. These frauds have no evidence, and all the evidence stands against them. They confuse local weather with global climate, and hee haw at each other.mage 2 of 6 (play slideshow) Download
Arctic Sea Ice News and Analysis | Sea ice data updated daily with one-day lag
Looks like there is considerably less ice for this time of year than in most previous years.
Fort Fun Indiana
Diamond Member
- Mar 10, 2017
- 92,485
- 58,121
- 2,645
See what I mean?What was the average temperature at the north pole on June 30th, 1918?
Fort Fun Indiana
Diamond Member
- Mar 10, 2017
- 92,485
- 58,121
- 2,645
Of course, barring magic spells or voodoo chants, the ocean and land ice will continue to recede, as the planet warms.That was a quote from Polar Portal, which is a site of these people;Compared to the average extent (1979-2000), the sea ice had diminished by 49%.
Statements like that are blatant misrepresentations because it not rigidly specified. You could see that from the graph you posted. It uses the 11.9% SUMMER extent decadal decline rate to get the 49% since 1979. But the WINTER extent is less than a 1/5 of that. That's why you NORMALIZE year over year to get something like NSIDC plots.
At LEAST qualify the statement with "summer extent" and then we can chat about how ICE is worst proxy for reading temperature and temperatures effects on the planet.
© 2018 - DMI, DTU, GEUS.
Funding for creating and running this website is provided with support from Dancea (Danish Cooperation for Environment in the Arctic) under the Danish Ministry for Energy, Utilities and Climate.
DMI, GEUS and DTU are responsible for the content of the site.
That's fine. Everyone makes honest mistakes if it's not an actual published paper. But too often, it seems to be done to grossly exaggerate. Yes, the Arctic sea ice is in decline. Does not mean the end of the world is at hand. Just means it crossed a threshhold some long time back where fall and spring days can bring short periods of stunted growth or melt. And those periods will result in bad years for sea ice. Even IF it's as short as a couple days above 0DegC.
1979 was relative HIGH for sea ice. And that is part of the problem here. Don't even have quite 40 years yet of reliable accounting.
Fort Fun Indiana
Diamond Member
- Mar 10, 2017
- 92,485
- 58,121
- 2,645
And, as the ice recedes, Earth's albedo will decrease and greenhouse gases will be released from the soil, both factors which will contribute to warming.
Similar threads
- Replies
- 51
- Views
- 3K
- Locked
- Replies
- 4
- Views
- 2K
- Replies
- 140
- Views
- 7K
- Replies
- 85
- Views
- 8K
Latest Discussions
- Replies
- 24
- Views
- 73
- Replies
- 54
- Views
- 257
- Replies
- 11
- Views
- 57
Forum List
-
-
-
-
-
Political Satire 8040
-
-
-
-
-
-
-
-
-
-
-
-
-
-
-
-
-
-
-
ObamaCare 781
-
-
-
-
-
-
-
-
-
-
-
Member Usernotes 469
-
-
-
-
-
-
-
-
-
-