
- Dec 8, 2013
- 22,678
- 16,879
- 2,415
The Global Cooling Scare of the 1970s was real, there was a consensus, and it was all over the media. It flies in the face of the man-made warming campaign. After World War II there was a massive industrial escalation in the West. And just as coal fired power was going in everywhere, the world damnwell cooled by -0.3°C. It’s obvious that the modern Climate Witches don’t want people bringing this up.
ccording to Richards even the CIA knew the models and met experts predicted cooling:
According to scientists reporting to the U.S. Central Intelligence Agency (1974), 22 of 27 forecasting methods predicted a cooling trend for the next 25 years, and “meteorological experts” were thinking an 1800s climate was around the corner, with the concomitant return to monsoon failures, shorter growing seasons, and “violent weather”.
A few papers:
Nelson et al., 1975 Concerned about cooling
“Concern about climatic change and its effects on man has been increasing. Climatic changes affect the production of food and the allocation of energy resources. … Even with the temperature corrections included, Indiana June, July and August mean temperatures showed a decrease of approximately 3°F [-1.7°C] from 1930 to 1976.”
Douglas, 1975 — the possibility of an iceage:
“According to the academy report on climate, we may be approaching the end of a major interglacial cycle, with the approach of a full-blown 10,000-year ice age a real possibility.”
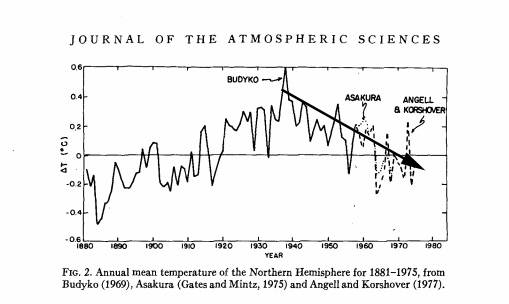
Cimorelli and House, 1974 , Schneider, 1974 — A fall of 0.3C
Introduction: “In the last century it is possible to document an increase of about 0.6°C in the mean global temperature between 1880 and 1940 and a subsequent fall of temperature by about 0.3°C since 1940.
Collis, 1975 – temperatures peaked in 1940
“It is not clear how such favorable and relatively consistent conditions are related to the higher temperatures in this century or the peaking of temperatures around 1940. The reversal of this warming trend, however, could mark the beginning of a new ice age as some climatologists have indicated.
-----------------------------------------
The danger of the left wing mind and their toad like reality.
ccording to Richards even the CIA knew the models and met experts predicted cooling:
According to scientists reporting to the U.S. Central Intelligence Agency (1974), 22 of 27 forecasting methods predicted a cooling trend for the next 25 years, and “meteorological experts” were thinking an 1800s climate was around the corner, with the concomitant return to monsoon failures, shorter growing seasons, and “violent weather”.
A few papers:
Nelson et al., 1975 Concerned about cooling
“Concern about climatic change and its effects on man has been increasing. Climatic changes affect the production of food and the allocation of energy resources. … Even with the temperature corrections included, Indiana June, July and August mean temperatures showed a decrease of approximately 3°F [-1.7°C] from 1930 to 1976.”
Douglas, 1975 — the possibility of an iceage:
“According to the academy report on climate, we may be approaching the end of a major interglacial cycle, with the approach of a full-blown 10,000-year ice age a real possibility.”
Cimorelli and House, 1974 , Schneider, 1974 — A fall of 0.3C
Introduction: “In the last century it is possible to document an increase of about 0.6°C in the mean global temperature between 1880 and 1940 and a subsequent fall of temperature by about 0.3°C since 1940.
Collis, 1975 – temperatures peaked in 1940
“It is not clear how such favorable and relatively consistent conditions are related to the higher temperatures in this century or the peaking of temperatures around 1940. The reversal of this warming trend, however, could mark the beginning of a new ice age as some climatologists have indicated.
-----------------------------------------
The danger of the left wing mind and their toad like reality.

