Global Investment in Wind and Solar Energy Is Outshining Fossil Fuels

Gee.. Time for a stock market update on Solar ETFunds boys and girls..
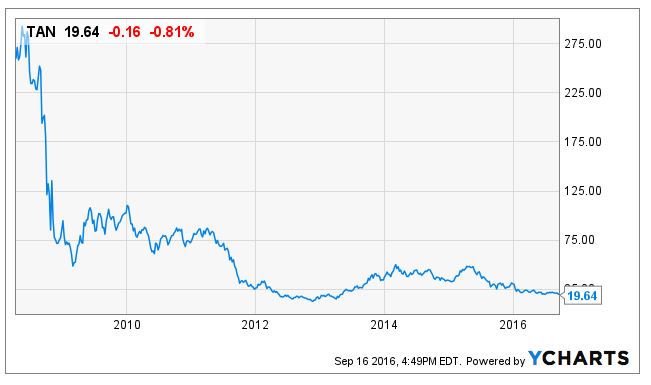
3690871_14746385102354_rId5.jpg
What is that a Graph of? Link?

1. I made an ASS out of you and your claim showing EXLOSION of Solar from 2008-2012.

2. "Solar ETF Funds' ONLY SHOWS THE CHINESE TARGETING I NOTED.. and Increased Competition/PRODUCXTION


DISHOINEST GRAPH
RESIGN YOUR POST

3. Here is thru 2016

AWEA-4.jpg


Game Over 2

And tyou are a DISHONEST MFer.

Lots of dead birds there:(
 
LOL...
How many will die from this stupidity...
Its amazing the facts the left will leave out to promote the agenda..
How many die due to the Current stupidity: polluted air, water, and food chain?

BACKFIRE time

Money Talks, Billy Bob Walks.
Blo me.
`
Your so busy blowing yourself you wouldn't know a fact if it bit you in the ass..

Again with the lying about what conservatives believe??... It was Obama clones who polluted the Colorado and the democrap idiots in Flint.. Your projection of your own faults is noted.

Now Abu A fucky, Do you really believe that what you posted is factual? Do you believe your green fan monsters will save you? How reliable are they? or your solar panels... do they work 24/7/365? Do you believe, Like Old Crock, that name plate values are what they produce 24/7/365 ?
 
Last edited:
$30Mill on $30Bill? OK --- not bragging material. How'd they hide all the losses? Because AMERICAN solar died a pretty horrible death under the OBama Admin..
BS.
There was a famous Bankruptcy of a Govt subsidized co because the Smart Chinese were targeting that industry. They also put the largest German Solar co out.

Does this look like "death" to you?
looks more like an Obama EXPLOSION to me.

Solar power in the United States - Wikipedia
1280px-Top_5_Solar_States.png


GAME OVER.
`
Fucking moron...

Installed capacity is NOT operating reality...
 
Gee.. Time for a stock market update on Solar ETFunds boys and girls..

3690871_14746385102354_rId5.jpg
What is that a Graph of? Link?

1. I made an ASS out of you and your claim showing EXLOSION of Solar from 2008-2012.

2. "Solar ETF Funds" (LOFL) ONLY SHOWS THE CHINESE TARGETING I NOTED.. and Increased Competition/PRODUCTION

DISHONEST GRAPH
RESIGN YOUR POST

3. Here is thru 2016

AWEA-4.jpg


Game Over 2

And you are a DISHONEST MFer.
Who didn't post output but a deflecting graph.
3
You are NOT smart enuf to debate me.

I'm smart enough not to be TROLLED by you. That's for certain. All those numbers have to get divided by 3 or more. And it's FUCKING WIND. The source you can't write a contract for.

Hi --- I'm from Pennsylvania Electric System operator -- I'd like to buy 450MWatts of wind for next Tuesday from 4AM to Noon. What's the price?

Oh -- Tuesdays are bad for us lately maybe we could supply 15% on Tuesday and the rest spread out over the rest of the week?

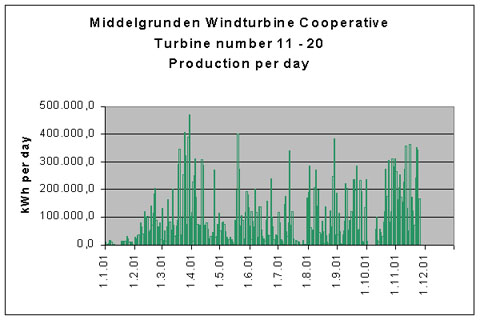
Are you fucking kidding me? You ever SEE the daily production charts from a fucking wind farm? I'm betting your troll ass never has. Kinda IMPORTANT to such an "expert" like yourself -- dontchathink?

Wind Energy in Australia | April 2018 | Aneroid

Uncheck all the black boxes at the bottom of the graph except VIC1 and then NSW1. WHERE is the energy gonna come from when the all the wind in Victoria or New S. Wales dies in 15 minutes????
 
Those production charts from wind farms show exactly how deluded and punked you've been. THey are NOT "an alternative" in any sense of the word. They are AT BEST a very sketchy supplement.

There's a LOT of engineering and system design even to work wind into a system grid without destabilizing it. And most of the numbers you're porking out on are happy knumbskull numbers without any reality attached to them.

Go FIND me a reliable wind farm that is an "ALTERNATIVE" to anything..
WAPA (Western Area Power Administration) is currently placing huge capacitor banks in its switching stations in an effort to keep brown outs from happening during lag times in power switching. Its not a perfect solution but at least its one that will keep the grid from crashing in less than two second power outages or drop offs.

they are using their DC/DC shunts between grids to do this.
 
Gee.. Time for a stock market update on Solar ETFunds boys and girls..

3690871_14746385102354_rId5.jpg
What is that a Graph of? Link?

1. I made an ASS out of you and your claim showing EXLOSION of Solar from 2008-2012.

2. "Solar ETF Funds" (LOFL) ONLY SHOWS THE CHINESE TARGETING I NOTED.. and Increased Competition/PRODUCTION

DISHONEST GRAPH
RESIGN YOUR POST

3. Here is thru 2016

AWEA-4.jpg


Game Over 2

And you are a DISHONEST MFer.
Who didn't post output but a deflecting graph.
3
You are NOT smart enuf to debate me.

I'm smart enough not to be TROLLED by you. That's for certain. All those numbers have to get divided by 3 or more. And it's FUCKING WIND. The source you can't write a contract for.

Hi --- I'm from Pennsylvania Electric System operator -- I'd like to buy 450MWatts of wind for next Tuesday from 4AM to Noon. What's the price?

Oh -- Tuesdays are bad for us lately maybe we could supply 15% on Tuesday and the rest spread out over the rest of the week?

Are you fucking kidding me? You ever SEE the daily production charts from a fucking wind farm? I'm betting your troll ass never has. Kinda IMPORTANT to such an "expert" like yourself -- dontchathink?

Wind Energy in Australia | April 2018 | Aneroid

Uncheck all the black boxes at the bottom of the graph except VIC1 and then NSW1. WHERE is the energy gonna come from when the all the wind in Victoria or New S. Wales dies in 15 minutes????
My chart was edited to this one.

YOU Lied or Ignorantly said Solar "Died" under Obama.
Production went up BIG time and not just from 2008-2012.
Both of his 2 terms.


Screen-Shot-2017-12-31-at-02.24.28.png


You DISHONESTLY OR IGNORANTLY posted the Stock Performance of Solar ETFs (LOFL), which only Confirms the Competition/Increased Production, and Chinese predatory activity I Introduced/Explained before you Perverted and Conflated industry stock prices with production.

GAME OVER #3.
Again: You either Dishonestly or Ignorantly Conflated Solar Stock performance with Solar Output.
Not smart enough or honest enough to debate me.
Still
`
 
Last edited:
Those production charts from wind farms show exactly how deluded and punked you've been. THey are NOT "an alternative" in any sense of the word. They are AT BEST a very sketchy supplement.

There's a LOT of engineering and system design even to work wind into a system grid without destabilizing it. And most of the numbers you're porking out on are happy knumbskull numbers without any reality attached to them.

Go FIND me a reliable wind farm that is an "ALTERNATIVE" to anything..
WAPA (Western Area Power Administration) is currently placing huge capacitor banks in its switching stations in an effort to keep brown outs from happening during lag times in power switching. Its not a perfect solution but at least its one that will keep the grid from crashing in less than two second power outages or drop offs.

they are using their DC/DC shunts between grids to do this.

The Japanese have the engineering EXACTLY correct. They do not allow wind installations without a 15 minute capacity bank of "super-caps" or batteries. It literally DOUBLES the cost of the installation, but it prevents outages and system damage.

And you STILL get the sketchy, unreliable and UNMARKETABLE performance that those daily production charts show..
 
Gee.. Time for a stock market update on Solar ETFunds boys and girls..

3690871_14746385102354_rId5.jpg
What is that a Graph of? Link?

1. I made an ASS out of you and your claim showing EXLOSION of Solar from 2008-2012.

2. "Solar ETF Funds" (LOFL) ONLY SHOWS THE CHINESE TARGETING I NOTED.. and Increased Competition/PRODUCTION

DISHONEST GRAPH
RESIGN YOUR POST

3. Here is thru 2016

AWEA-4.jpg


Game Over 2

And you are a DISHONEST MFer.
Who didn't post output but a deflecting graph.
3
You are NOT smart enuf to debate me.

I'm smart enough not to be TROLLED by you. That's for certain. All those numbers have to get divided by 3 or more. And it's FUCKING WIND. The source you can't write a contract for.

Hi --- I'm from Pennsylvania Electric System operator -- I'd like to buy 450MWatts of wind for next Tuesday from 4AM to Noon. What's the price?

Oh -- Tuesdays are bad for us lately maybe we could supply 15% on Tuesday and the rest spread out over the rest of the week?

Are you fucking kidding me? You ever SEE the daily production charts from a fucking wind farm? I'm betting your troll ass never has. Kinda IMPORTANT to such an "expert" like yourself -- dontchathink?

Wind Energy in Australia | April 2018 | Aneroid

Uncheck all the black boxes at the bottom of the graph except VIC1 and then NSW1. WHERE is the energy gonna come from when the all the wind in Victoria or New S. Wales dies in 15 minutes????
My chart was edited to this one.

YOU Lied or Ignorantly said Solar "Died" under Obama.
Production went up BIG time and not just from 2008-2012.
Both of his 2 terms.


Screen-Shot-2017-12-31-at-02.24.28.png


You DISHONESTLY OR IGNORANTLY posted the Stock Performance of Solar ETFs (LOFL), which only Confirms the Competition/Increased Production, and Chinese predatory activity I Introduced/Explained before you Perverted and Conflated industry stock prices with production.

GAME OVER #3.
Again: You either Dishonestly or Ignorantly Conflated Solar Stock performance with Solar Output.
Not smart enough or honest enough to debate me.
Still
`
And yet with all this name plate installation wattage, we are still at or below 2% of total grid function.. And its wholly unreliable..
 
Gee.. Time for a stock market update on Solar ETFunds boys and girls..

3690871_14746385102354_rId5.jpg
What is that a Graph of? Link?

1. I made an ASS out of you and your claim showing EXLOSION of Solar from 2008-2012.

2. "Solar ETF Funds" (LOFL) ONLY SHOWS THE CHINESE TARGETING I NOTED.. and Increased Competition/PRODUCTION

DISHONEST GRAPH
RESIGN YOUR POST

3. Here is thru 2016

AWEA-4.jpg


Game Over 2

And you are a DISHONEST MFer.
Who didn't post output but a deflecting graph.
3
You are NOT smart enuf to debate me.

I'm smart enough not to be TROLLED by you. That's for certain. All those numbers have to get divided by 3 or more. And it's FUCKING WIND. The source you can't write a contract for.

Hi --- I'm from Pennsylvania Electric System operator -- I'd like to buy 450MWatts of wind for next Tuesday from 4AM to Noon. What's the price?

Oh -- Tuesdays are bad for us lately maybe we could supply 15% on Tuesday and the rest spread out over the rest of the week?

Are you fucking kidding me? You ever SEE the daily production charts from a fucking wind farm? I'm betting your troll ass never has. Kinda IMPORTANT to such an "expert" like yourself -- dontchathink?

Wind Energy in Australia | April 2018 | Aneroid

Uncheck all the black boxes at the bottom of the graph except VIC1 and then NSW1. WHERE is the energy gonna come from when the all the wind in Victoria or New S. Wales dies in 15 minutes????
My chart was edited to this one.

YOU Lied or Ignorantly said Solar "Died" under Obama.
Production went up BIG time and not just from 2008-2012.
Both of his 2 terms.


Screen-Shot-2017-12-31-at-02.24.28.png


You DISHONESTLY OR IGNORANTLY posted the Stock Performance of Solar ETFs (LOFL), which only Confirms the Competition/Increased Production, and Chinese predatory activity I Introduced/Explained before you Perverted and Conflated industry stock prices with production.

GAME OVER #3.
Again: You either Dishonestly or Ignorantly Conflated Solar Stock performance with Solar Output.
Not smart enough or honest enough to debate me.
Still
`

You're not even UNDERSTANDING the issue. You keep posting the same shit and ignore the MARKET performance and the ACTUAL WIND performance issues.

Your chart Your chart -- it doesn't even have a labeled Y axis. You have any solutions for the UNDERLYING FLAWS in wind power that I showed you for the very 1st time?

If the technology is that great -- why does the MARKET INVESTMENT look like a dead cat bouncing? And you're DEAD WRONG and totally unprepared for all this NEW information I'm giving you. The FAN ETF is a GLOBAL Wind index fund. Not just a US Wind Index fund.

73519-PricingChart-06162008-06082018.png


The TAN ETF that I posted for Solar is also a GLOBAL index fund. No investment confidence in either. Are all those economic experts and investors WRONG there Abu???

3-4 decades ago PV and wind were the penchant of off grid renegades , hippy dippys ,unusual sorts. Now Joe average is considering them in his yard or roof.

The technological advances along with the ROI make it all attratctive ,most poco's are along for the ride for a plethora of reasons, REP (rural electrification program) era infastructure, aging nuke facilities, foreign owned generation, etc ad nasuem.

It's a juggernaut industry who's only reins are political ignorance , and mostly in America where corporatism rules ,and science is their b*tch

Other countries seem to have matured beyond that

~S~
No!

Other nations have had massive grid failures and rolling brown outs.. They are now looking for other alternatives... Look at the UK who have lost 20% of their wind velocity, rendering their wind output useless. they are scrambling to find energy.
 
No!

Other nations have had massive grid failures and rolling brown outs.. They are now looking for other alternatives... Look at the UK who have lost 20% of their wind velocity, rendering their wind output useless. they are scrambling to find energy.
LOL

Renewable energy in the United Kingdom - Wikipedia

From the mid-1990s renewable energy began to contribute to the electricity generated in the United Kingdom, adding to a small hydroelectricity generating capacity. The total of all renewable electricity sources provided for 14.9% of the electricity generated in the United Kingdom in 2013,[4] reaching 53.7 TWh of electricity generated.

In the second quarter of 2015, renewable electricity generation exceeded 25% and Coal generation for the first time.[5]

As of 2nd quarter 2017, renewables generated 29.8% of the UK's electricity.[6]

Renewable energy contributions to meeting the UK's 15% target reduction in total energy consumption by 2020, in accordance with the 2009 EU Renewable Directive, totalled 5.2% in 2013 as measured in accordance with the methodology set out in the Directive.[4] By 2016 provisional calculations show that the figure had risen again to 8.3% of energy consumption (all sources) coming from renewable sources in 2015.[7]

Interest in renewable energy in the UK has increased in recent years...
[......]
Wind
Wind power delivers a growing fraction of the energy in the United Kingdom and at the beginning of January 2015, wind power in the United Kingdom consisted of 6,546 wind turbines with a total installed capacity of just under 12 gigawatts: 7,950 megawatts of onshore capacity and 4,049 megawatts of offshore capacity.[30]
The United Kingdom is ranked as the world's sixth largest producer of wind power, having overtaken France and Italy in 2012.[31]
Polling of public opinion consistently shows strong support for wind power in the UK, with nearly 3/4 of the population agreeing with its use, even for people living near onshore wind turbines. Wind power is expected to continue growing in the UK for the foreseeable future.
[......]

UK_renewables_installed_capacity.PNG


Billy_BOOB just points to ANECDOTES and folklore.
`
 
Last edited:
No!

Other nations have had massive grid failures and rolling brown outs.. They are now looking for other alternatives... Look at the UK who have lost 20% of their wind velocity, rendering their wind output useless. they are scrambling to find energy.
LOL

Renewable energy in the United Kingdom - Wikipedia

From the mid-1990s renewable energy began to contribute to the electricity generated in the United Kingdom, adding to a small hydroelectricity generating capacity. The total of all renewable electricity sources provided for 14.9% of the electricity generated in the United Kingdom in 2013,[4] reaching 53.7 TWh of electricity generated.

In the second quarter of 2015, renewable electricity generation exceeded 25% and Coal generation for the first time.[5]

As of 2nd quarter 2017, renewables generated 29.8% of the UK's electricity.[6]

Renewable energy contributions to meeting the UK's 15% target reduction in total energy consumption by 2020, in accordance with the 2009 EU Renewable Directive, totalled 5.2% in 2013 as measured in accordance with the methodology set out in the Directive.[4] By 2016 provisional calculations show that the figure had risen again to 8.3% of energy consumption (all sources) coming from renewable sources in 2015.[7]

Interest in renewable energy in the UK has increased in recent years...
[......]
Wind
Wind power delivers a growing fraction of the energy in the United Kingdom and at the beginning of January 2015, wind power in the United Kingdom consisted of 6,546 wind turbines with a total installed capacity of just under 12 gigawatts: 7,950 megawatts of onshore capacity and 4,049 megawatts of offshore capacity.[30]
The United Kingdom is ranked as the world's sixth largest producer of wind power, having overtaken France and Italy in 2012.[31]
Polling of public opinion consistently shows strong support for wind power in the UK, with nearly 3/4 of the population agreeing with its use, even for people living near onshore wind turbines. Wind power is expected to continue growing in the UK for the foreseeable future.
[......]

UK_renewables_installed_capacity.PNG


Billy_BOOB just points to ANECDOTES and folklore.
`
Your a liar!

But then that's the leftard way...

http://www.eci.ox.ac.uk/publications/downloads/sinden06-windresource.pdf

Analysis: The impact of La Niña on UK wind power.

Cooling oceans are lowering wind speeds across them... I would tell you to read up on the issues but you must first know how to read technical documents. You have proven yourself ignorant of how these systems work and why they fail...
 
LOL...
How many will die from this stupidity...
Its amazing the facts the left will leave out to promote the agenda..
How many die due to the Current stupidity: polluted air, water, and food chain?

BACKFIRE time

Money Talks, Billy Bob Walks.
Blo me.
`
post those stats punk! you wish to make a comment like that you best be prepared to back it up.
 
Gee.. Time for a stock market update on Solar ETFunds boys and girls..

3690871_14746385102354_rId5.jpg
What is that a Graph of? Link?

1. I made an ASS out of you and your claim showing EXLOSION of Solar from 2008-2012.

2. "Solar ETF Funds" (LOFL) ONLY SHOWS THE CHINESE TARGETING I NOTED.. and Increased Competition/PRODUCTION

DISHONEST GRAPH
RESIGN YOUR POST

3. Here is thru 2016

AWEA-4.jpg


Game Over 2

And you are a DISHONEST MFer.
Who didn't post output but a deflecting graph.
3
You are NOT smart enuf to debate me.

I'm smart enough not to be TROLLED by you. That's for certain. All those numbers have to get divided by 3 or more. And it's FUCKING WIND. The source you can't write a contract for.

Hi --- I'm from Pennsylvania Electric System operator -- I'd like to buy 450MWatts of wind for next Tuesday from 4AM to Noon. What's the price?

Oh -- Tuesdays are bad for us lately maybe we could supply 15% on Tuesday and the rest spread out over the rest of the week?

Are you fucking kidding me? You ever SEE the daily production charts from a fucking wind farm? I'm betting your troll ass never has. Kinda IMPORTANT to such an "expert" like yourself -- dontchathink?

Wind Energy in Australia | April 2018 | Aneroid

Uncheck all the black boxes at the bottom of the graph except VIC1 and then NSW1. WHERE is the energy gonna come from when the all the wind in Victoria or New S. Wales dies in 15 minutes????
My chart was edited to this one.

YOU Lied or Ignorantly said Solar "Died" under Obama.
Production went up BIG time and not just from 2008-2012.
Both of his 2 terms.


Screen-Shot-2017-12-31-at-02.24.28.png


You DISHONESTLY OR IGNORANTLY posted the Stock Performance of Solar ETFs (LOFL), which only Confirms the Competition/Increased Production, and Chinese predatory activity I Introduced/Explained before you Perverted and Conflated industry stock prices with production.

GAME OVER #3.
Again: You either Dishonestly or Ignorantly Conflated Solar Stock performance with Solar Output.
Not smart enough or honest enough to debate me.
Still
`

You're not even UNDERSTANDING the issue. You keep posting the same shit and ignore the MARKET performance and the ACTUAL WIND performance issues.

Your chart Your chart -- it doesn't even have a labeled Y axis. You have any solutions for the UNDERLYING FLAWS in wind power that I showed you for the very 1st time?

If the technology is that great -- why does the MARKET INVESTMENT look like a dead cat bouncing? And you're DEAD WRONG and totally unprepared for all this NEW information I'm giving you. The FAN ETF is a GLOBAL Wind index fund. Not just a US Wind Index fund.

73519-PricingChart-06162008-06082018.png


The TAN ETF that I posted for Solar is also a GLOBAL index fund. No investment confidence in either. Are all those economic experts and investors WRONG there Abu???

3-4 decades ago PV and wind were the penchant of off grid renegades , hippy dippys ,unusual sorts. Now Joe average is considering them in his yard or roof.

The technological advances along with the ROI make it all attratctive ,most poco's are along for the ride for a plethora of reasons, REP (rural electrification program) era infastructure, aging nuke facilities, foreign owned generation, etc ad nasuem.

It's a juggernaut industry who's only reins are political ignorance , and mostly in America where corporatism rules ,and science is their b*tch

Other countries seem to have matured beyond that

~S~

It's funny you should mention off-grid applications for solar and wind. There are SEVERAL off-grids apps that make superb sense.. Instead of PRETENDING that these are "plug-in alternatives" for other 24/7/365 sources of power.

The main NEGATIVES of wind/solar which is lack of storage and scheduling actually become positives if you're PRODUCING and STORING some quantity that is valuable. Desalinization is a PRIME example. Because you deal with "stored averages" of the water you produce and "brown-outs" are not likely to matter in the long run.

The same thing could be done to produce a hydrogen intrastucture for refilling fuel cell technologies. Both for fixed site and mobile power. The fuel you produce has NO RECURRING energy charges to produce. There'd be a line out the door for franchises and competitors lining up to produce hydrogen fuel this way.

Both wind and solar are very mature technologies. That's why there's a bloodbath on pricing. They've had their shot. Expect no miracles here. Without awesome site development breaks, subsidies and even waivers on Enviro assessments, there'd be no "fools rush" to be a power provider using these "supplements" which are NOT alternatives..
 
No!

Other nations have had massive grid failures and rolling brown outs.. They are now looking for other alternatives... Look at the UK who have lost 20% of their wind velocity, rendering their wind output useless. they are scrambling to find energy.
LOL

Renewable energy in the United Kingdom - Wikipedia

From the mid-1990s renewable energy began to contribute to the electricity generated in the United Kingdom, adding to a small hydroelectricity generating capacity. The total of all renewable electricity sources provided for 14.9% of the electricity generated in the United Kingdom in 2013,[4] reaching 53.7 TWh of electricity generated.

In the second quarter of 2015, renewable electricity generation exceeded 25% and Coal generation for the first time.[5]

As of 2nd quarter 2017, renewables generated 29.8% of the UK's electricity.[6]

Renewable energy contributions to meeting the UK's 15% target reduction in total energy consumption by 2020, in accordance with the 2009 EU Renewable Directive, totalled 5.2% in 2013 as measured in accordance with the methodology set out in the Directive.[4] By 2016 provisional calculations show that the figure had risen again to 8.3% of energy consumption (all sources) coming from renewable sources in 2015.[7]

Interest in renewable energy in the UK has increased in recent years...
[......]
Wind
Wind power delivers a growing fraction of the energy in the United Kingdom and at the beginning of January 2015, wind power in the United Kingdom consisted of 6,546 wind turbines with a total installed capacity of just under 12 gigawatts: 7,950 megawatts of onshore capacity and 4,049 megawatts of offshore capacity.[30]
The United Kingdom is ranked as the world's sixth largest producer of wind power, having overtaken France and Italy in 2012.[31]
Polling of public opinion consistently shows strong support for wind power in the UK, with nearly 3/4 of the population agreeing with its use, even for people living near onshore wind turbines. Wind power is expected to continue growing in the UK for the foreseeable future.
[......]

UK_renewables_installed_capacity.PNG


Billy_BOOB just points to ANECDOTES and folklore.
`


An AWESOME 12GWatts of Wind in the UK huh little man? There's a lot of wind in every one of your posts.

How about we CHECK RIGHT NOW as to what that 12Gwatt Wind CAPACITY is generating RIGHT NOW THIS MOMENT in UK...
G. B. National Grid status
As I read the gauge - - it's producing a MERE 1.8GWatts of power.. :banana: Go read it again BEFORE you reply. MAYBE -- it will be producing 20% of the capacity those idiots PAID FOR -- or maybe it will be producing NOTHING.. :auiqs.jpg:

Since it;s already pretty dusky over there -- solar is producing buttkiss. But NEVER FEAR -- the Brits SOLD their folks on "Biomass Conversion" which is NEITHER CLEAR OR GREEN but counts as an "renewable". So despite the screams of all well meaning Greenies that BEGGED for biomass incinerators and now HATE THEM -- the Brits will burning GARBAGE all night long to get their "green" numbers up..
 

Forum List

Back
Top