Midnight Marauder
Rookie
- Feb 28, 2009
- 12,404
- 1,939
- 0
- Banned
- #41
OldCrocks will never admit he is wrong, no matter how well it's proven, and will never man-up when he's made a mistake.You can't run from it Old Rocks.
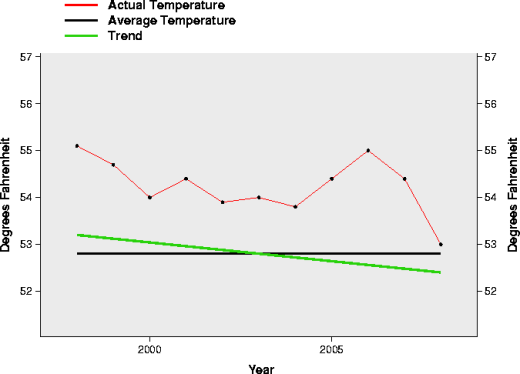
You utilized a Roy Spencer graph in defense of your flat earth warming theory when in fact Dr. Spencer feels quite the opposite regarding man-made global warming. Spencer notes warming and cooling have occurred, and nothing regarding the more recent warming appears in any way remarkable from previous periods. CO2 as a causative agent is likely given far too much importance, the earth's climate is far more vast and complicated than the flat-earth warmers wish to admite, and whatever warming is taking place - even if contributed via CO2, is no big deal.
No religious fundie ever does!