Global Cooling in 2009

Very interesting. Very interesting, indeed. Especially since the oceans were hotter July through August of 2009 than has ever been recorded before.

In hot water: World sets ocean temperature record (Update)
The average water temperature worldwide was 62.6 degrees, according to the National Climatic Data Center, the branch of the U.S. government that keeps world weather records. June was only slightly cooler, while August could set another record, scientists say. The previous record was set in July 1998 during a powerful El Nino.
.......................................................................
Not only that, but November, 2009, was the warmest November, worldwide, ever recorded in the past 185 years. Very possible that December will also be a very warm month, worldwide.

So how does that fit this particular geologist's prediction?

I will make a prediction right here. In the next five years. two of them will exceed 1998. More than likely, 2010 will be one of those years.


Geologist forecasts global cooling - 15/05/2009

Friday, 15/05/2009

An Australian geologist and author claims it's the natural cycles of the sun that change climate, not greenhouse gas emissions.

David Archibald also says the planet is actually going to cool down over the next decade.

He says the world is entering its 24th solar cycle, where the magnetic poles of the sun swap around.

Mr Archibald says the evidence is there to prove his theory that this happens every 11 years or so.

"You can see a solar signal, an 11-year solar signal even in wheat prices in England back in the 18th century," he says.

"It does affect climate. Parts of the world will be getting 2.8 degrees colder over the next 10 years."

you are funny.... the evidence? What evidence? RECORD LOW TEMPS? That evidence?


Global Cooling is Here

Global Research Editor's note

The following article represents an alternative view and analysis of global climate change, which challenges the dominant Global Warming Consensus.

Global Research does not necessarily endorse the proposition of "Global Cooling", nor does it accept at face value the Consensus on Global Warming. Our purpose is to encourage a more balanced debate on the topic of global climate change.

Easterbrook is full of shit. But he made some very definate predictions. So when those predictions totally fail, what are you going to say then? But I know what you will say. You will claim you never believed him in the first place, and it is all for some other reason that GHGs.

Why don't you check the lectures at the American Geophysical Union in San Francisco this December. See how many of them are predicting global cooling. Here is were you can see the lectures;

2009 AGU Fall Meeting: Featured Lectures

These are the best of the best in Geology. Note how many of them are predicting cooling.
 
Very interesting. Very interesting, indeed. Especially since the oceans were hotter July through August of 2009 than has ever been recorded before.

In hot water: World sets ocean temperature record (Update)
The average water temperature worldwide was 62.6 degrees, according to the National Climatic Data Center, the branch of the U.S. government that keeps world weather records. June was only slightly cooler, while August could set another record, scientists say. The previous record was set in July 1998 during a powerful El Nino.
.......................................................................
Not only that, but November, 2009, was the warmest November, worldwide, ever recorded in the past 185 years. Very possible that December will also be a very warm month, worldwide.

So how does that fit this particular geologist's prediction?

I will make a prediction right here. In the next five years. two of them will exceed 1998. More than likely, 2010 will be one of those years.


Geologist forecasts global cooling - 15/05/2009

Friday, 15/05/2009

An Australian geologist and author claims it's the natural cycles of the sun that change climate, not greenhouse gas emissions.

David Archibald also says the planet is actually going to cool down over the next decade.

He says the world is entering its 24th solar cycle, where the magnetic poles of the sun swap around.

Mr Archibald says the evidence is there to prove his theory that this happens every 11 years or so.

"You can see a solar signal, an 11-year solar signal even in wheat prices in England back in the 18th century," he says.

"It does affect climate. Parts of the world will be getting 2.8 degrees colder over the next 10 years."

you are funny.... the evidence? What evidence? RECORD LOW TEMPS? That evidence?

Record low temperatures? When the analomy was a +0.50? On any given day, some place in the world is colder than it has been recorded before. On any given day, it is warmer some place in the world than it has been recorded before.

However, the overall temperature is rising arround the world. Note that the data I gave you for the 2009 temperatures was from Roy Spencer, a skeptic, who seems to be a lot less skeptical lately.


Global Cooling is Here

Global Research Editor's note

The following article represents an alternative view and analysis of global climate change, which challenges the dominant Global Warming Consensus.

Global Research does not necessarily endorse the proposition of "Global Cooling", nor does it accept at face value the Consensus on Global Warming. Our purpose is to encourage a more balanced debate on the topic of global climate change.

Easterbrook is full of shit. But he made some very definate predictions. So when those predictions totally fail, what are you going to say then? But I know what you will say. You will claim you never believed him in the first place, and it is all for some other reason that GHGs.

Why don't you check the lectures at the American Geophysical Union in San Francisco this December. See how many of them are predicting global cooling. Here is were you can see the lectures;

2009 AGU Fall Meeting: Featured Lectures

These are the best of the best in Geology. Note how many of them are predicting cooling.

All these asshats that support AGW and have been peddling GLOBAL WARMING have failed with their predictions. The hockey stick theory that started all this bs has been thoroughly debunked. Both Michael Mann and Al Gore have demonstrated that they are lying idiots.
 
OK, I looked at the really idiotic graphs on your first link. Watt is a liar and a charlatan. How the hell do you get away with a dotted 'projection' line through existing data? A line in total variance with the data.

Data @ NASA GISS: GISS Surface Temperature Analysis (GISTEMP)

Geology News: Global Warming Graph and Map Information

Remote Sensing Tutorial Page 16-2

Global Warming -- Research Issues

Global Warming Stopped in 1998 — OSS Foundation

Real data from real scientists, not the charlatans that you posted.


Keep drinking the koolaid, the MAN BEAR PIG is out of the bag.

A Major Deception on Global Warming

The Hockey Stick scam that heightened global warming hysteria

Austria sees earliest snow in history, and America sees lowest temperatures in 50 years: So where did global warming go? | Mail Online

Damn. Your first link is Sietz. A senile tobacco company whore. The man has no standing in the scientific community anymore.

LOL... you are a true idiot. Thanks for proving my point. The only WHORES are the AGW peddlers that got caught lying, and are trying to steal billions from the world.


Global Cooling is Here

Global Research Editor's note

The following article represents an alternative view and analysis of global climate change, which challenges the dominant Global Warming Consensus.

Global Research does not necessarily endorse the proposition of "Global Cooling", nor does it accept at face value the Consensus on Global Warming. Our purpose is to encourage a more balanced debate on the topic of global climate change.

Easterbrook is full of shit. But he made some very definate predictions. So when those predictions totally fail, what are you going to say then? But I know what you will say. You will claim you never believed him in the first place, and it is all for some other reason that GHGs.

Why don't you check the lectures at the American Geophysical Union in San Francisco this December. See how many of them are predicting global cooling. Here is were you can see the lectures;

2009 AGU Fall Meeting: Featured Lectures

These are the best of the best in Geology. Note how many of them are predicting cooling.

All these asshats that support AGW and have been peddling GLOBAL WARMING have failed with their predictions. The hockey stick theory that started all this bs has been thoroughly debunked. Both Michael Mann and Al Gore have demonstrated that they are lying idiots.

None of the data the I posted was from Dr. Mann, or from Al Gore.

No, the hockey stick graph has been confirmed by at least 14 differant studies using differant statistical methods than Dr. Mann. Here is an article from the November, 2009 issue of the Scientific American, the latest study that confirms the Mann graph.

Al Gore took what the scientists have been saying and put it into laymans words. He did not get it totally right, but did a very good job for a non-scientist.


Novel Analysis Confirms Climate "Hockey Stick" Graph: Scientific American

The “hockey stick” graph has been both a linchpin and target in the climate change debate. As a plot of average Northern Hemisphere temperature from two millennia ago to the present, it stays relatively flat until the 20th century, when it rises up sharply, like the blade of an upturned hockey stick. Warming skeptics have long decried how the temperatures were inferred, but a new reconstruction of the past 600 years, using an entirely different method, finds similar results and may help remove lingering doubts.
 

Damn. Your first link is Sietz. A senile tobacco company whore. The man has no standing in the scientific community anymore.

LOL... you are a true idiot. Thanks for proving my point. The only WHORES are the AGW peddlers that got caught lying, and are trying to steal billions from the world.

Dr. Frederick Seitz, whore.

The Konformist Blog: The Manufactured Doubt industry

In 1988, the fossil fuel industry realized it had a serious problem. The summer of 1988 had shattered century-old records for heat and drought in the U.S., and NASA's Dr. James Hansen, one of the foremost climate scientists in the world, testified before Congress that human-caused global warming was partially to blame. A swelling number of scientific studies were warning of the threat posed by human-cause climate change, and that consumption of fossil fuels needed to slow down. Naturally, the fossil fuel industry fought back. They launched a massive PR campaign that continues to this day, led by the same think tanks that worked to discredit the ozone depletion theory. The George C. Marshall Institute, the Competitive Enterprise Institute, Heartland Institute, and Dr. Fred Singer's SEPP (Science and Environmental Policy Project) have all been key players in both fights, and there are numerous other think tanks involved. Many of the same experts who had worked hard to discredit the science of the well-established link between cigarette smoke and cancer, the danger the CFCs posed to the ozone layer, and the dangers to health posed by a whole host of toxic chemicals, were now hard at work to discredit the peer-reviewed science supporting human-caused climate change.

As is the case with any Manufactured Doubt campaign, a respected scientist was needed to lead the battle. One such scientist was Dr. Frederick Seitz, a physicist who in the 1960s chaired the organization many feel to be the most prestigious science organization in the world--the National Academy of Sciences. Seitz took a position as a paid consultant for R.J. Reynolds tobacco company beginning in 1978, so was well-versed in the art of Manufactured Doubt. According to the excellent new book, Climate Cover-up, written by desmogblog.com co-founder James Hoggan and Richard Littlemore, over a 10-year period Seitz was responsible for handing out $45 million in tobacco company money to researchers who overwhelmingly failed to link tobacco to anything the least bit negative. Seitz received over $900,000 in compensation for his efforts. He later became a founder of the George C. Marshall Institute, and used his old National Academy of Sciences affiliation to lend credibility to his attacks on global warming science until his death in 2008 at the age of ninety-six. It was Seitz who launched the "Oregon Petition", which contains the signatures of more than 34,000 scientists saying global warming is probably natural and not a crisis. The petition is a regular feature of the Manufactured Doubt campaign against human-caused global warming. The petition lists the "Oregon Institute of Science and Medicine" as its parent organization. According to Climate Cover-up, the Institute is a farm shed situated a couple of miles outside of Cave Junction, OR (population 17,000). The Institute lists seven faculty members, two of whom are dead, and has no ongoing research and no students. It publishes creationist-friendly homeschooler curriculums books on surviving nuclear war. The petition was sent to scientists and was accompanied by a 12-page review printed in exactly the same style used for the prestigious journal, Proceedings of the National Academy of Sciences. A letter from Seitz, who is prominently identified as a former National Academy of Sciences president, accompanied the petition and review. Naturally, many recipients took this to be an official National Academy of Sciences communication, and signed the petition as a result. The National Academy issued a statement in April 2008, clarifying that it had not issued the petition, and that its position on global warming was the opposite. The petition contains no contact information for the signers, making it impossible to verify. In its August 2006 issue, Scientific American presented its attempt to verify the petition. They found that the scientists were almost all people with undergraduate degrees, with no record of research and no expertise in climatology. Scientific American contacted a random sample of 26 of the 1,400 signatories claiming to have a Ph.D. in a climate related science. Eleven said they agreed with the petition, six said they would not sign the petition today, three did not remember the petition, one had died, and five did not respond.
 
http://scienceandpublicpolicy.org/monckton_papers/errors_in_al_gore_s_an_inconvenient_truth.html

QUOTE (National Academy of Sciences)

Even less confidence can be placed in the original conclusions by Mann et al. (1999) that "the 1990s are likely the warmest decade, and 1998 the warmest year, in at least a millennium"

Prior to about 1600, ...periods of medieval warmth are seen in a number of diverse records, including historical information from Europe and Asia; cave deposits; marine and lake sediments; and ice cores from Greenland, Ellesmere Island, Tibet, and the equatorial Andes.

Using proxies sensitive to hydrologic variables (including moisture-sensitive trees...) to take advantage of observed correlations with surface temperature could lead to problems

For tree ring chronologies, the process of removing biological trends from ringwidth data potentially obscures information on long-term changes in climate.

Large-scale surface temperature reconstructions yield a generally consistent picture of temperature trends during the preceding millennium, including relatively warm conditions centered around A.D. 1000 (identified by some as the “Medieval Warm Period”) and a relatively cold period (or “Little Ice Age”) centered around 1700. The existence and extent of a Little Ice Age from roughly 1500 to 1850 is supported by a wide variety of evidence including ice cores, tree rings, borehole temperatures, glacier length records, and historical documents. Evidence for regional warmth during medieval times can be found in a diverse ...set of records including ice cores, tree rings, marine sediments, and historical sources from Europe and Asia

FACT: All the NAS study concluded was that recent temperatures are warmer than the Little Ice Age. No kidding!

QUOTE

We share the assessment of the NRC committee that the evidence for unprecedented warming of a single decade or even a single year in times prior to 1500, or so, is stretching the scientific evidence too far. However, this was the key claim made in the contested 1998-nature and 1999-GRL-papers by Mann et al.

With respect to methods, the committee is showing reservations concerning the methodology of Mann et al.. The committee notes explicitly on pages 91 and 111 that the method has no validation (CE) skill significantly different from zero. In the past, however, it has always been claimed that the method has a significant nonzero validation skill. Methods without a validation skill are usually considered useless.

Thus, the public perception that the hockeystick as truthfully describing the temperature history was definitely false.

We find it disappointing that the method of Mann et al. was not sufficiently described in the original publication, and thus not peer-reviewed prior to publication, and that no serious efforts were made to allow independent researchers to check the performance of the methods and of the data used.

VZG Statement on NAS Panel « Climate Audit

http://www.uoguelph.ca/~rmckitri/research/NAS.op-ed.pdf

Congressional Hearings Break 'Hockey Stick' - by H. Sterling Burnett, Ph.D. - Environment & Climate News

http://scienceandpublicpolicy.org/images/stories/papers/monckton/monckton_what_hockey_stick.pdf

http://icecap.us/images/uploads/revivalhockey.pdf

http://www.climateaudit.org/pdf/ohioshort.pdf

http://ross.mckitrick.googlepages.com/Stattered.Consensus.Ch2.pdf
 
Last edited:
So a twelve year cooling trend with increased CO2 levels means nothing all of a sudden? Predicted warming that has not come to pass doesn't cause global warmers to reevaluate their data model? Man is not a factor here. Better to take these efforts and manage the ozone better or mitigate some other real environmental problem.
 
So a twelve year cooling trend with increased CO2 levels means nothing all of a sudden? Predicted warming that has not come to pass doesn't cause global warmers to reevaluate their data model? Man is not a factor here. Better to take these efforts and manage the ozone better or mitigate some other real environmental problem.

Cooling trend?

Top 11 Warmest Years On Record Have All Been In Last 13 Years

Global 10 Warmest Years Mean Global temperature (°C) (anomaly with respect to 1961-1990)

1998 0.52
2005 0.48
2003 0.46
2002 0.46
2004 0.43
2006 0.42
2007(Jan-Nov) 0.41
2001 0.40
1997 0.36
1995 0.28

And 2008 and 2009 will push 1997 and 1995 off of the chart. Some cooling!

Yes, a cooling trend. The chart referenced earlier was quite specific about that. As for your claim that Mr. Monckton was some type of loon. His findings are very interesting:

Climate chaos? Don't believe it - Telegraph

The Royal Society says there's a worldwide scientific consensus. It brands Apocalypse-deniers as paid lackeys of coal and oil corporations. I declare my interest: I once took the taxpayer's shilling and advised Margaret Thatcher, FRS, on scientific scams and scares. Alas, not a red cent from Exxon.

In 1988, James Hansen, a climatologist, told the US Congress that temperature would rise 0.3C by the end of the century (it rose 0.1C), and that sea level would rise several feet (no, one inch). The UN set up a transnational bureaucracy, the Intergovernmental Panel on Climate Change (IPCC). The UK taxpayer unwittingly meets the entire cost of its scientific team, which, in 2001, produced the Third Assessment Report, a Bible-length document presenting apocalyptic conclusions well beyond previous reports.

This week, I'll show how the UN undervalued the sun's effects on historical and contemporary climate, slashed the natural greenhouse effect, overstated the past century's temperature increase, repealed a fundamental law of physics and tripled the man-made greenhouse effect.

Climate chaos? Don't believe it

By Christopher Monckton, Sunday Telegraph
Published: 12:01AM GMT 05 Nov 2006

Previous1 of 2 ImagesNext
Biblical droughts, floods, plagues and extinctions?
Download Christopher Monckton's references and detailed calculations [pdf]

The Stern report last week predicted dire economic and social effects of unchecked global warming. In what many will see as a highly controversial polemic, Christopher Monckton disputes the 'facts' of this impending apocalypse and accuses the UN and its scientists of distorting the truth


Related Articles
Global warming fears yet few willing to cut back
A genuine threat or a political bandwagon?
Damning truth about Brown and green taxes
Last week, Gordon Brown and his chief economist both said global warming was the worst "market failure" ever. That loaded soundbite suggests that the "climate-change" scare is less about saving the planet than, in Jacques Chirac's chilling phrase, "creating world government". This week and next, I'll reveal how politicians, scientists and bureaucrats contrived a threat of Biblical floods, droughts, plagues, and extinctions worthier of St John the Divine than of science.

Sir Nicholas Stern's report on the economics of climate change, which was published last week, says that the debate is over. It isn't. There are more greenhouse gases in the air than there were, so the world should warm a bit, but that's as far as the "consensus" goes. After the recent hysteria, you may not find the truth easy to believe. So you can find all my references and detailed calculations here.

The Royal Society says there's a worldwide scientific consensus. It brands Apocalypse-deniers as paid lackeys of coal and oil corporations. I declare my interest: I once took the taxpayer's shilling and advised Margaret Thatcher, FRS, on scientific scams and scares. Alas, not a red cent from Exxon.

In 1988, James Hansen, a climatologist, told the US Congress that temperature would rise 0.3C by the end of the century (it rose 0.1C), and that sea level would rise several feet (no, one inch). The UN set up a transnational bureaucracy, the Intergovernmental Panel on Climate Change (IPCC). The UK taxpayer unwittingly meets the entire cost of its scientific team, which, in 2001, produced the Third Assessment Report, a Bible-length document presenting apocalyptic conclusions well beyond previous reports.

This week, I'll show how the UN undervalued the sun's effects on historical and contemporary climate, slashed the natural greenhouse effect, overstated the past century's temperature increase, repealed a fundamental law of physics and tripled the man-made greenhouse effect.

Next week, I'll demonstrate the atrocious economic, political and environmental cost of the high-tax, zero-freedom, bureaucratic centralism implicit in Stern's report; I'll compare the global-warming scare with previous sci-fi alarums; and I'll show how the environmentalists' "precautionary principle" (get the state to interfere now, just in case) is killing people.

So to the scare. First, the UN implies that carbon dioxide ended the last four ice ages. It displays two 450,000-year graphs: a sawtooth curve of temperature and a sawtooth of airborne CO2 that's scaled to look similar. Usually, similar curves are superimposed for comparison. The UN didn't do that. If it had, the truth would have shown: the changes in temperature preceded the changes in CO2 levels.

Next, the UN abolished the medieval warm period (the global warming at the end of the First Millennium AD). In 1995, David Deming, a geoscientist at the University of Oklahoma, had written an article reconstructing 150 years of North American temperatures from borehole data. He later wrote: "With the publication of the article in Science, I gained significant credibility in the community of scientists working on climate change. They thought I was one of them, someone who would pervert science in the service of social and political causes. One of them let his guard down. A major person working in the area of climate change and global warming sent me an astonishing email that said: 'We have to get rid of the Medieval Warm Period.' "

Looks to me like the well paid scientists are the global warmers. They are scared because the jig is up and the cash cow about to die.
 
As usual, Monkton is a lying. Lying about a real and respected scientist.

‘Hansen has been wrong before’—Maybe, but not about the climate! | How to Talk to a Climate Skeptic: Responses to the most common skeptical arguments on global warming | Grist

Objection: In 1988, Hansen predicted dire warming over the next decade -- and he was off by 300%. Why in the world should we listen to the same doom and gloom from him today?

Answer: While in some instances it is ignorant repetition of misinformation, at its source this story is a plain lie.

In 1988, James Hansen testified before the U.S. Senate on the danger of anthropogenic global warming. During that testimony he presented a graph -- part of a paper published soon after. This graph had three lines on it, representing three scenarios based on three projections of future emissions and volcanism.


Line A was a temperature trend prediction based on rapid emissions growth and no large volcanic event; it was a steep climb through the year 2000 and beyond.

Line B was based on modest emissions growth and one large volcanic eruption in the mid 1990s.

Line C began along the same trajectory as Line B, and included the same volcanic eruption, but showed reductions in the growth of CO2 emission by the turn of the century -- the result of hypothetical government controls.

As it happens, since Hansen's testimony, emissions have grown at a modest rate and Mt. Pinatubo did in fact erupt, though in the early 1990s, not the middle. In other words, the Line B forcings scenario came remarkably close to predicting what actually came to pass
 
Look how much effort the Goebbels Warming religious fundie cultist OldCrocks spends here, getting his ass kicked again, compared to my threads he RUNS from because his pasted regurgitated garbage doesn't work at all!

Since he himself belied it!

He's like a Jehovah's Witness with a Watchtower pamphlet! :lol:

Except he's Witless!
 
As usual, Monkton is a lying. Lying about a real and respected scientist.

‘Hansen has been wrong before’—Maybe, but not about the climate! | How to Talk to a Climate Skeptic: Responses to the most common skeptical arguments on global warming | Grist

Objection: In 1988, Hansen predicted dire warming over the next decade -- and he was off by 300%. Why in the world should we listen to the same doom and gloom from him today?

Answer: While in some instances it is ignorant repetition of misinformation, at its source this story is a plain lie.

In 1988, James Hansen testified before the U.S. Senate on the danger of anthropogenic global warming. During that testimony he presented a graph -- part of a paper published soon after. This graph had three lines on it, representing three scenarios based on three projections of future emissions and volcanism.


Line A was a temperature trend prediction based on rapid emissions growth and no large volcanic event; it was a steep climb through the year 2000 and beyond.

Line B was based on modest emissions growth and one large volcanic eruption in the mid 1990s.

Line C began along the same trajectory as Line B, and included the same volcanic eruption, but showed reductions in the growth of CO2 emission by the turn of the century -- the result of hypothetical government controls.

As it happens, since Hansen's testimony, emissions have grown at a modest rate and Mt. Pinatubo did in fact erupt, though in the early 1990s, not the middle. In other words, the Line B forcings scenario came remarkably close to predicting what actually came to pass

That is a misrepresentation on your part. Mr. Hansen was promoting the line A scenario as what would happen (rapid emisions growth). We actually had line B (modest growth). Line C has no bearing, because we can't prove or disprove it. You lose.
 
SPPI? And there chief 'scientist' is Chris Monkton, the ersazt Lord? The man has zero scientific credentials. He is a fraud.

climate-wheel1x-large.jpg


Here's how the Warmers at MIT make their predictions*

*Not a joke, those are really the Climate "scientists" at MIT
 
So a twelve year cooling trend with increased CO2 levels means nothing all of a sudden? Predicted warming that has not come to pass doesn't cause global warmers to reevaluate their data model? Man is not a factor here. Better to take these efforts and manage the ozone better or mitigate some other real environmental problem.

Cooling trend?

Top 11 Warmest Years On Record Have All Been In Last 13 Years

Global 10 Warmest Years Mean Global temperature (°C) (anomaly with respect to 1961-1990)

1998 0.52
2005 0.48
2003 0.46
2002 0.46
2004 0.43
2006 0.42
2007(Jan-Nov) 0.41
2001 0.40
1997 0.36
1995 0.28

And 2008 and 2009 will push 1997 and 1995 off of the chart. Some cooling!

Hide the decline, Bro
 
So a twelve year cooling trend with increased CO2 levels means nothing all of a sudden? Predicted warming that has not come to pass doesn't cause global warmers to reevaluate their data model? Man is not a factor here. Better to take these efforts and manage the ozone better or mitigate some other real environmental problem.

Cooling trend?

Top 11 Warmest Years On Record Have All Been In Last 13 Years

Global 10 Warmest Years Mean Global temperature (°C) (anomaly with respect to 1961-1990)

1998 0.52
2005 0.48
2003 0.46
2002 0.46
2004 0.43
2006 0.42
2007(Jan-Nov) 0.41
2001 0.40
1997 0.36
1995 0.28

And 2008 and 2009 will push 1997 and 1995 off of the chart. Some cooling!

We had one of the coolest years on record here.
 
You can't run from it Old Rocks.

You utilized a Roy Spencer graph in defense of your flat earth warming theory when in fact Dr. Spencer feels quite the opposite regarding man-made global warming. Spencer notes warming and cooling have occurred, and nothing regarding the more recent warming appears in any way remarkable from previous periods. CO2 as a causative agent is likely given far too much importance, the earth's climate is far more vast and complicated than the flat-earth warmers wish to admit, and whatever warming is taking place - even if contributed via CO2, is no big deal.


But you used that graph w/o knowing the source. You regurg. data you cannot understand. You simply parrot the flat earth warmer theory without showing any intellectual curiousity as to the actual "science" behind that theory, or the implications of self interest in coordinating data to support said theory.

What we do know is this - the global warming architects, the figures most responsible for the data which is then re-used repeatedly by other "studies" were found guilty of "hiding the decline" and attempting to aggressively squash any dissent within the scientific community. There has been no appreciable warming in the last decade, and the most recent winters have been among the coldest of the last century.

Perhaps Dr. Spencer - the guy whose graphs you yourself are using, said it best...


This website currently concentrates on the response of clouds to warming, an issue which I am now convinced the scientific community has totally misinterpreted when they have measured natural, year-to-year fluctuations in the climate system. As a result of that confusion, they have the mistaken belief that climate sensitivity is high, when in fact the satellite evidence suggests climate sensitivity is low.

...The case for natural climate change I also present an analysis of the Pacific Decadal Oscillation which shows that most climate change might well be the result of….the climate system itself!

Climate change — it happens, with or without our help.


Global Warming: Natural or Manmade? « Roy Spencer, Ph. D.
_________


And you are totally full of shit. 2009 will rank somewhere between the 5th warmest and 2nd warmest year on record in the last 185 years. Depending on how warm December is.

You are just another fool that cannot tell the differance between a transient weather event, and a long term trend.

All of the warmest years on record have been between 1998 and 2009. But you claim a cooling trend. What a fool you are.


November 2009 UAH Global Temperature Update +0.50 deg. C « Roy Spencer, Ph. D.

______

Ah - you are using Roy Spencer's data! Excellent!

Here are some recent observations from Dr. Spencer regarding the the idea of "man-made" global warming...


...As Dick Lindzen alluded to back in 1990, while everyone seems to understand that the greenhouse effect warms the Earth’s surface, few people are aware of the fact that weather processes greatly limit that warming. And one very real possibility is that the 1 deg. C direct warming effect of doubling our atmospheric CO2 concentration by late in this century will be mitigated by the cooling effects of weather to a value closer to 0.5 deg. C or so (about 1 deg. F.) This is much less than is being predicted by the UN’s Intergovernmental Panel on Climate Change or by NASA’s James Hansen, who believe that weather changes will amplify, rather than reduce, that warming.[/B]

...Global Warming: Natural or Manmade?
“Global warming” refers to the global-average temperature increase that has been observed over the last one hundred years or more. But to many politicians and the public, the term carries the implication that mankind is responsible for that warming. This website describes evidence from my group’s government-funded research that suggests global warming is mostly natural, and that the climate system is quite insensitive to humanity’s greenhouse gas emissions and aerosol pollution.


...The case for natural climate change I also present an analysis of the Pacific Decadal Oscillation which shows that most climate change might well be the result of….the climate system itself! Because small, chaotic fluctuations in atmospheric and oceanic circulation systems can cause small changes in global average cloudiness, this is all that is necessary to cause climate change. You don’t need the sun, or any other ‘external’ influence (although these are also possible…but for now I’ll let others work on that). It is simply what the climate system does. This is actually quite easy for meteorologists to believe, since we understand how complex weather processes are. Your local TV meteorologist is probably a closet ’skeptic’ regarding mankind’s influence on climate.

Climate change — it happens, with or without our help.


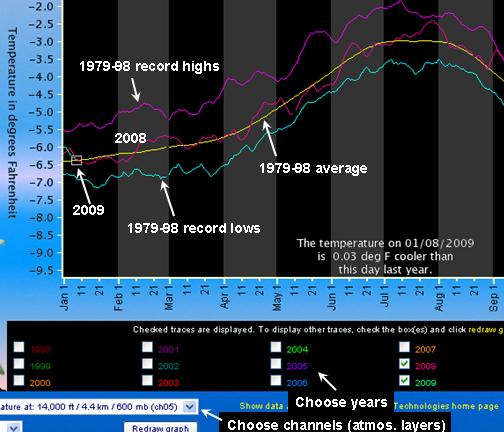
And here Dr. Spencer shows us how this month's temps are "shaping up" - they are damn COLD!!! (2009 is on the left side)


discover-amsu5-trends-screenshot1.jpg


Roy Spencer, Ph. D.
 
Last edited:

Forum List

Back
Top