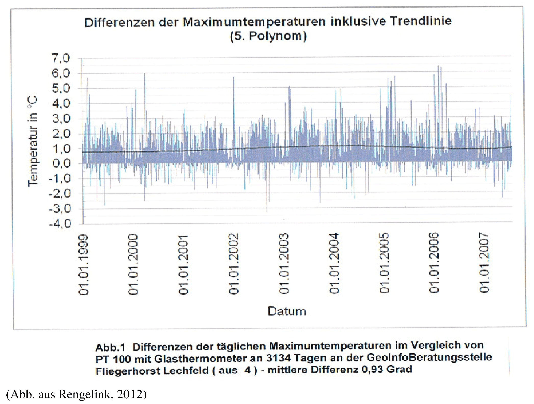
That bulletin was about the results of his eight and a half year study where he compared in a side-by-side test the former glass mercury thermometers with the newer electronic thermometers, which were installed during the 1980s and 1990s by Germany’s DWD German Weather Service. - See more at: NoTricksZone Not here to worship what is known but to question it 8211 Jacob Bronowski. Climate news from Germany in English 8211 by Pierre L. Gosselin
hmmmm.....the new thermometers were phased in the 80's and 90's, I wonder if it shows in the temperature history? maybe.
this little story from Germany brings a few questions to mind. why did it take so long for it to come out? the data is seven years old. perhaps more importantly the author is 73 years old, hahahahaha.
NOAA has a similar experiment going on. the preliminary results came out a few years ago and they seemed at odds with official predictions for methodologies, especially UHI. what happened to that experiment? and why can't I find it on google anymore?
I would like to see the long term comparisons of old and new thermometers and methodologies for US data, wouldnt you?