
Statistikhengst
Diamond Member
- Banned
- #1
Party Affiliation Gallup Historical Trends
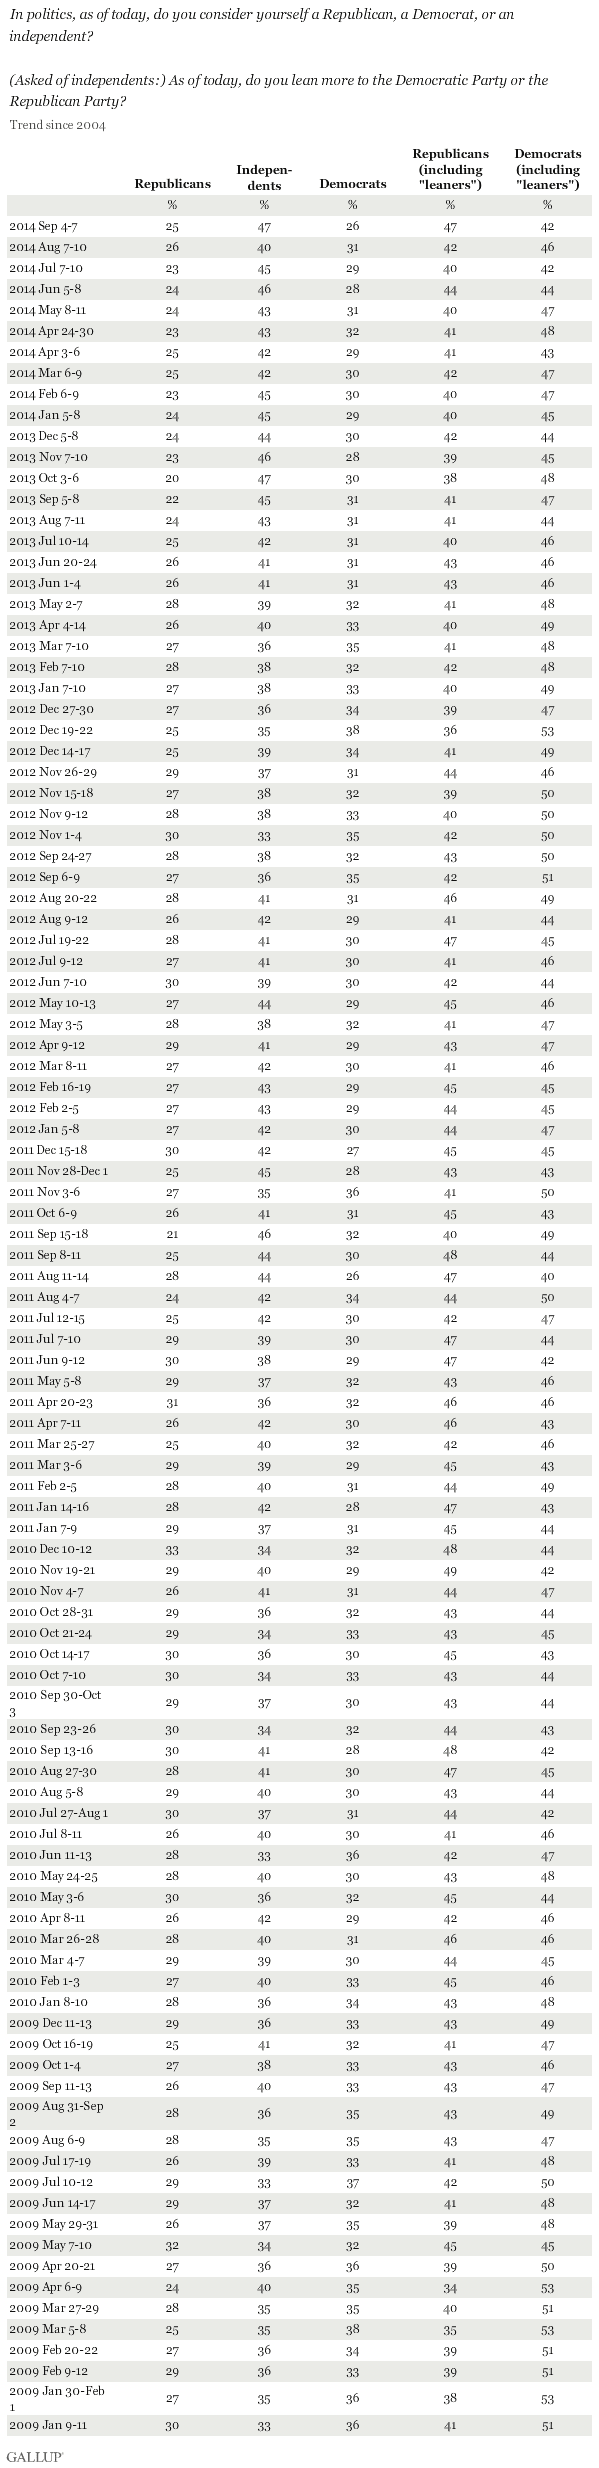
That would be probably a record high. Gallup also claims that if you recount the Independents, which states classify as "unaffiliated" - mostly as "leaners" to one party or another, it's then R47 / D2.
Now, setting aside Gallup's dismal record in both 2010 and 2012, I have just crunched all of the most recent actual Voter Registration data for 48 of 50 states, plus DC.
In a nutshell, as of yesterday's statistic, 183,037,283 US Citizens are registered to vote.
At the end of 2013 there were 183,821,274 US Citizens registered to vote. I did an analysis of that HERE. So, there has been a slight drop-off from the end of 2013 until today, of 0.42%, between December 2013 and today.
28 states + DC publish voter registration by party affiliation online. 2 more give out the information if you write to them. That makes for 31 "states".
18 states publish voter registration, but not by party affiliation. They just give a total number.
1 state, Mississippi, does voter registration, but not by party affilliation, but it does NOT publish it's statistics.
1 state, ND, does not have any voter registration at all.
This configuration of states is exactly as it was in December, 2013. No state has switched from one reporting system to the other (VR with Party Identification vs. VR without Party Identification)
So, I have stats on 49 of 51 "states", including DC, in the overall statistic.
Of the 31 "states" that do VR by party registration, here are the end stats:
D: 39.33%
R: 28.75%
Unaffiliated: 28.53%
IND (3rd party): 3.39%
Margin: D +10.58%
It should be noted, however, in that statistic are some very "red" states that still have majority or high minority D VR, like WV, KY, LA and OK.
Gallup claims, however, that 47% of the public is unaffiliated. That may or may not be true for the public as a whole, but it is likely UNTRUE under those who are actually registered. And since only those who are registered can actually go to vote, then that is the real ballgame.
Simple math: that above figure of 183,037,283 is comprised of 111,301,204 voters in the 31 states that do VR by party affiliation (60.81% of all registered voters), and 71,736,079 voters in states that do VR but without party identification (39.19% of all registered voters).
According to the latest stats, 31,754,060 Americans are officially listed as unaffiliated within the total of 111,301,2014 from the 31 "states" that keep those kinds of records. That's 28.53%.
Remember, Gallup claims that 47% are unaffiliated.
Ok:
183,087,283 * .47 = 86,051,023. So, if Gallup's claim were to be true for those who are actually registered, we would have 86+ million unaffiliateds.
Now, 31,754,060 unaffiliateds are officially accounted for from the 31 "states" that do VR by party affiliation.
86,051,023 - 31,754,060 = 54,296,963
This means that if Gallup were to be absolutely correct, then 54,296,963 voters from the 18 states that do VR but not by party identification would have to be unaffiliateds:
54,296,963 / 71,736,079 = 75.69%
So, somehow, in those 18 states, 3 out of every 4 voters would then have to be unaffiliated.
Here are those 18 states:
Al, AR, GA, HI, ID, IL, IN, MI, MN, MO, MT, SC, TN, TX, VT, VA, WA, WI.
Here is the list of 18 states again, this time color coded based on their performance in the 2012 GE:
Al, AR, GA, HI, ID, IL, IN, MI, MN, MO, MT, SC, TN, TX, VT, VA, WA, WI.
10 red states, 9 of them GOP landslide states in 2012.
8 blue states, 5 of the DEM landslide states in 2012.
It is hard to imagine that in 14 states where the one party won major landslides, that 75% of their voters are now unaffiliateds.
The point I am making is that maybe Gallup interviewed a lot of people who are really disillusioned with the US Government - which I can understand, but the actual VR stats as they stand simply do not back up Gallup's claim.
In two days, I will be putting up a complete thread about all of the VR stats and their implications, but for now, here is the set of excel tables, all linked to sources (excepting OH and RI):
VR Statistics 2014 - 99% complete.
Now, that number, 183,037,283 - is always changing slightly, every day. People die and fall out of the statistic, new voters come into the statistic and the states are in no way uniform has to how and WHEN they publish VR data. This is a point that will be covered in the large analysis that comes out on Thursday.
However, the numbers clearly indicate that far less than 47% of voters, at least the ones who are actually registered, are unaffiliateds.
Once again, Gallup has likely shot itself in the foot.