Forecast Discussion: Rapid Cooling Ahead.. Its already started...

Billy_Bob

Diamond Member
Sep 4, 2014
30,837
20,605
1,945
Top Of The Great Divide
Forecast Discussion: Rapid Cooling Ahead.. Its already started...

I posted this graph of global temps a few days back. Since then I have been in discussions with other meteorologists about what the trend now implies for the US and northern hemisphere in general.

mauecfsv2globalnhshta2mbis191220151-e1450606466594.jpg


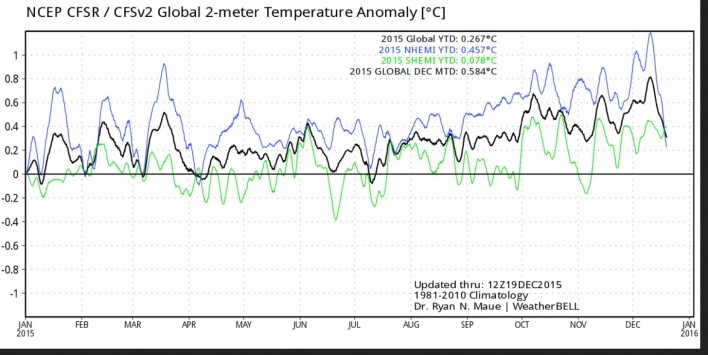
The rapid decline of NH temps is stunning and as of today it has cooled by 1.17 deg C. (current NH anomaly is 0.18 deg C) The blue line is the northern hemisphere. The black line is global, and the light green is the southern hemisphere.

The polar regions are stabilizing and the polar jets are increasing in size and speed in both hemispheres, but primarily the NH has become much wider. Pressures have dipped at both poles indicating a lower solar output reaching these regions. Ocean heat is now having almost no effect on global temps and the suns DWIR has decreased by 0.72% due to particulate matter high in our atmosphere. The fires in the NH and SH are the driving forces in that particulate matter. (funny how natural cycles of drought and fire are part of the system, keeping our planet cool and near thermal equilibrium. Yet man putting out natural fires might have the effect of allowing the planet to warm beyond what has been seen in the paleo record. But that's for another thread)

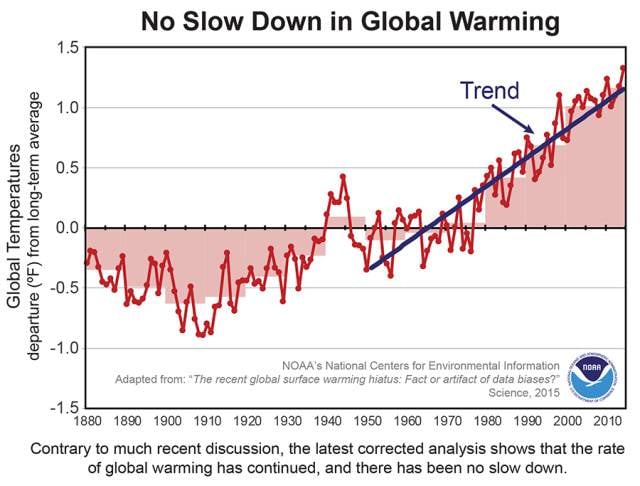
We are now in a cooling phase of the planet and even though alarmists will tout the warmest ev'a year (in 37 years of semi-accurate record keeping) Its going to be to little warming (all within the earths natural variation boundaries) and to late...

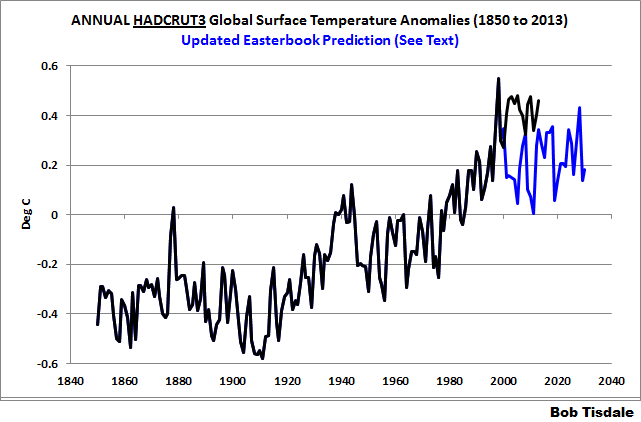
In 1997-1998 we saw a step change in temperature that most climatologists and atmospheric physics people today do not see being repeated. The graphing above shows why. The latent heat is already gone and will not persist.

seaice.recent.arctic.png


Sea Ice has returned to near mean levels over the last 40 years and globally we are right on the mean again. Ice loss is not a problem and natural swings we have seen the last 10 years are the norm not the abnormal as others have touted.

NSIDC%20GlobalArcticAntarctic%20SeaIceArea.gif


What were entering now is a cooling phase where the oceans are all cooling rapidly and circulations change to support this. In the Atlantic the circulations have changed and cold is now the game in the Hudson bay and around Iceland, Greenland, and the Canadian coast.

Cooling in the Pacific, the blob is all but gone and cooling has now returned around the Alaska and the Bering Straights. The ocean shift has occurred and now the cooler circulations will persist for the next 20-30 years.

Natural variation is about to kick AGW in the teeth again as the hemisphere and globe continue to cool rapidly and the modest temp rise of +0.68 deg C (over 65 years) is erased in short order. There are to many factors now showing cooling. Even the US CRN shows a cooling trend now for over 14 years of -0.4 deg C in that time period in line with satellite records showing excellent correlation.

All of the doom and gloom predictions of runaway heating have failed just like the IPCC models. Reality is about to kick alarmism very hard.


IF you want to discuss the whys, bring in facts and data.. Leave your hype crap at the door. Show me the evidence and tell me why you believe it.
 
Last edited:
We are now in a cooling phase of the planet

What were entering now is a cooling phase where the oceans are all cooling rapidly and circulations change to support this.

IF you want to discuss the whys, bring in facts and data.. Leave your hype crap at the door. Show me the evidence and tell me why you believe it.

The cooling phase of WHAT?

And, if you'd like to leave some hype crap at the door, grow some balls and admit to this audience that you do not have a degree in atmospheric physics.

LOL...

Just what I expected from you.... Crap!

Why dont you bring in the evidence to support your BS?
 
trend


Lets try some facts and not the unsupported hype.. I noticed crick posted a NOAA ADJUSTED TEMP LAND ONLY GRAPH without linking to its data or other subsets which crated it.

You will note there is NO CORRELATION with reality and real temps in that NOAA graph. The data i used for this graph can be found by going to: Wood for Trees: Interactive Graphs


Epic alarmist fail again there Crickham! The global data form 82.5N lat to 82.5S Lat is conclusive showing the NOAA graph is a made up construct of adjustments. Karl Et Al... funny you should try and use that crap to justify anything.
 
Crick, You really should try to cite you data sources. WFT uses the data archives of the originating agencies to construct their graphing.

Your going to find any appeals you make to authority challenged with unaltered data and facts.
 
So, you don't recognize Karl et al 2015 on sight? Got it. Well, go find it and you can not only have all the data, you can have all the adjustments, all the data processing, all the custom code and the names and addresses of the several PhDs that put it all together. When I look at a graph you made at Wood for Trees, all I see your worthless fucking doodle. Ya see, you're a known liar (see sig) and thus I have no reason whatsoever to believe anything you say about your pretty little picture. Why don't you go find us some data that someone else put together and that's actually passed peer review and been published?

PS: Karl et al's data is global, not "LAND ONLY". Surely you remember bucket data, buoy data, engine inlet data... ringing any bells?

PPS Where we really need to see some substantial references is when you say Karl et al 2015 has no correlation with reality,
 
Last edited:
We are now in a cooling phase of the planet

What were entering now is a cooling phase where the oceans are all cooling rapidly and circulations change to support this.

IF you want to discuss the whys, bring in facts and data.. Leave your hype crap at the door. Show me the evidence and tell me why you believe it.


The cooling phase of WHAT?

And, if you'd like to leave some hype crap at the door, grow some balls and admit to this audience that you do not have a degree in atmospheric physics.


Lets see if we can remove some of your ignorance;

globalcool61.jpg


The Pacific Ocean has a warm temperature mode and a cool temperature mode, and in the past century, has switched back forth between these two modes every 25-30 years (known as the Pacific Decadal Oscillation or PDO). In 1977 the Pacific abruptly shifted from its cool mode (where it had been since about 1945) into its warm mode, and this initiated global warming from 1977 to 1998. The correlation between the PDO and global climate is well established. The announcement by NASA’s Jet Propulsion Laboratory that the Pacific Decadal Oscillation (PDO) had shifted to its cool phase is right on schedule as predicted by past climate and PDO changes (Easterbrook, 2001, 2006, 2007). The PDO typically lasts 25-30 years and assures North America of cool, wetter climates during its cool phases and warmer, drier climates during its warm phases. The establishment of the cool PDO, together with similar cooling of the North Atlantic Oscillation (NAO), virtually assures several decades of global cooling and the end of the past 30-year warm phase.

Source

Eastbrooks 'B' scenario is the more likely path of the earth given what we have learned about CO2's inability to influence water vapor and its overall negative forcing. If you use ADJUSTED DATA Eastbrook's projection B has been right on the money.
 
Last edited:
So, you don't recognize Karl et al 2015 on sight? Got it. Well, go find it and you can not only have all the data, you can have all the adjustments, all the data processing, all the custom code and the names and addresses of the several PhDs that put it all together. When I look at a graph you made at Wood for Trees, all I see your worthless fucking doodle. Ya see, you're a known liar (see sig) and thus I have no reason whatsoever to believe anything you say about your pretty little picture. Why don't you go find us some data that someone else put together and that's actually passed peer review and been published?

PS: Karl et al's data is global, not "LAND ONLY". Surely you remember bucket data, buoy data, engine inlet data... ringing any bells?

PPS Where we really need to see some substantial references is when you say Karl et al 2015 has no correlation with reality,

Karl Et Al makes some very wild assumptions and alterations of data that cool the past and warm the present. His assumptions have little to do with science and a lot to do with political agenda.

Your correct on the graph; It is however hard to differentiate his two fabricated graphs from one another as the slope of gloom and doom are the same. Neither of which, reflect reality
 
OFor the second time: On WHAT do you base your belief that they do not reflect reality? And where do you get the idea that politics affected Karl et al?
 
It's colder than normal on the west coast. It was 25 degrees in Las Vegas this morning, however, it's a lot warmer than normal on the east coast. I've been in Jacksonville visiting family and it's been in the 80s every day here.
 
It's colder than normal on the west coast. It was 25 degrees in Las Vegas this morning, however, it's a lot warmer than normal on the east coast. I've been in Jacksonville visiting family and it's been in the 80s every day here.
Evidence of a strong polar jet. Cold air and lows causing wild swings of the polar jet as it forces cooler air towards the equator. The counter side of this coin is the warm air being pulled towards the poles resulting in wild swings of median latitude temperatures. Tell Mother Earth, thank you. When we again reach near thermal equilibrium, at a lower temp, this will not be the case and cold will be held closer to the poles.
 
OFor the second time: On WHAT do you base your belief that they do not reflect reality? And where do you get the idea that politics affected Karl et al?

You have got to be kidding me... I posted reality in graph form of unadjusted temps and you ignore it. Reality IS NOT REFLECTED by KARL Et Al!
 
I highly recommend purchasing at least one good used fur coat on Ebay. Winter is comin'.
 
I highly recommend purchasing at least one good used fur coat on Ebay. Winter is comin'.

Winter is....

But so is the loss of El Niño heat as evidenced by the Original post. The alarmists might get one month which will break the cooling trend (the pause) out of this dying El Niño event but with Decembers crash, their cry of joy, for some warming (and its not even man made) will be short lived. The 'Pause' or stop as I call it will be very evident in just about two months time when their "blip" will disappear from the long term trend as the influence of heat is shown gone.

It will be a devastating blow to their egos...
 
We are now in a cooling phase of the planet

What were entering now is a cooling phase where the oceans are all cooling rapidly and circulations change to support this.

IF you want to discuss the whys, bring in facts and data.. Leave your hype crap at the door. Show me the evidence and tell me why you believe it.


The cooling phase of WHAT?

And, if you'd like to leave some hype crap at the door, grow some balls and admit to this audience that you do not have a degree in atmospheric physics.


Lets see if we can remove some of your ignorance;

globalcool61.jpg


The Pacific Ocean has a warm temperature mode and a cool temperature mode, and in the past century, has switched back forth between these two modes every 25-30 years (known as the Pacific Decadal Oscillation or PDO). In 1977 the Pacific abruptly shifted from its cool mode (where it had been since about 1945) into its warm mode, and this initiated global warming from 1977 to 1998. The correlation between the PDO and global climate is well established. The announcement by NASA’s Jet Propulsion Laboratory that the Pacific Decadal Oscillation (PDO) had shifted to its cool phase is right on schedule as predicted by past climate and PDO changes (Easterbrook, 2001, 2006, 2007). The PDO typically lasts 25-30 years and assures North America of cool, wetter climates during its cool phases and warmer, drier climates during its warm phases. The establishment of the cool PDO, together with similar cooling of the North Atlantic Oscillation (NAO), virtually assures several decades of global cooling and the end of the past 30-year warm phase.

Source

Eastbrooks 'B' scenario is the more likely path of the earth given what we have learned about CO2's inability to influence water vapor and its overall negative forcing. If you use UNADJUSTED DATA Eastbrook's projection B has been right on the money.


Error correction of my previous post.
 

Forum List

Back
Top