Navigation
Install the app
How to install the app on iOS
Follow along with the video below to see how to install our site as a web app on your home screen.

Note: This feature currently requires accessing the site using the built-in Safari browser.
More options
You are using an out of date browser. It may not display this or other websites correctly.
You should upgrade or use an alternative browser.
You should upgrade or use an alternative browser.
For Crick- New Pages2k Data Paper
- Thread starter IanC
- Start date
- Dec 18, 2013
- 136,363
- 27,905
- 2,180
Jiminie, it's spelled "w-h-e-r-e"That's spelled L-I-A-R, jc
- Dec 18, 2013
- 136,363
- 27,905
- 2,180
so how was it supposed to warm up? Are you stating here that you know how the earth was supposed to warm coming out of the ice age? You can't prove what 120 PPM of CO2 can do to the temperatures, but you know how the earth was supposed to warm over the centuries. Now dude, that's amazing.
If you're trying to tell us the world hasn't experienced significant warming, unprecedented in several millennia, you put up the wrong graphs.

- Dec 18, 2013
- 136,363
- 27,905
- 2,180
I know what you are, thanks for the admission!!!That's spelled L-I-A-R, jc
SSDD
Gold Member
- Nov 6, 2012
- 16,672
- 1,966
- 280
Exactly what I expected of you. I just asked myself "how would a ten year old respond?"
Since he was responding to comments that appeared to have been made by a 6 year old, my bet is that he didn't want to get to far over your head.
Ian puts up eight graphs that all shown unprecedented warming in recent years. Jc thinks that must be the normal way for the Earth to come out of an ice age. He doesn't need reasons. That's a common failing among the unwashed denier clan: there is so little that takes place in the universe that they actually understand and so, out of habit, they grow completely complacent about things happen without (to them) identifiable cause and thus have no problem claiming this or that has happened without the slightest need to identify or even suggest a causative mechanism. How many denier's have claimed that the last century's warming is "just a cycle"? That it's "nature". They think of the Earth's temperature as if it were a bouncing rubber ball.
Ian. You may not be smart enough to get on the right side of this argument, but you're smart enough to realize that when the sides were getting picked, the deniers got SERIOUSLY shortchanged on intellect and education. The question is why you're so little bothered by that fact.
Ian. You may not be smart enough to get on the right side of this argument, but you're smart enough to realize that when the sides were getting picked, the deniers got SERIOUSLY shortchanged on intellect and education. The question is why you're so little bothered by that fact.
- Dec 18, 2013
- 136,363
- 27,905
- 2,180
Jiminie, JC here.... So you have the directions on how to come out of an ice age eh? Interesting.Ian puts up eight graphs that all shown unprecedented warming in recent years. Jc thinks that must be the normal way for the Earth to come out of an ice age. He doesn't need reasons. That's a common failing among the unwashed denier clan: there is so little that takes place in the universe that they actually understand and so, out of habit, they grow completely complacent about things happen without (to them) identifiable cause and thus have no problem claiming this or that has happened without the slightest need to identify or even suggest a causative mechanism. How many denier's have claimed that the last century's warming is "just a cycle"? That it's "nature". They think of the Earth's temperature as if it were a bouncing rubber ball.
Ian. You may not be smart enough to get on the right side of this argument, but you're smart enough to realize that when the sides were getting picked, the deniers got SERIOUSLY shortchanged on intellect and education. The question is why you're so little bothered by that fact.
SSDD
Gold Member
- Nov 6, 2012
- 16,672
- 1,966
- 280
Ian puts up eight graphs that all shown unprecedented warming in recent years. Jc thinks that must be the normal way for the Earth to come out of an ice age. He doesn't need reasons. That's a common failing among the unwashed denier clan: there is so little that takes place in the universe that they actually understand and so, out of habit, they grow completely complacent about things happen without (to them) identifiable cause and thus have no problem claiming this or that has happened without the slightest need to identify or even suggest a causative mechanism. How many denier's have claimed that the last century's warming is "just a cycle"? That it's "nature". They think of the Earth's temperature as if it were a bouncing rubber ball.
Ian. You may not be smart enough to get on the right side of this argument, but you're smart enough to realize that when the sides were getting picked, the deniers got SERIOUSLY shortchanged on intellect and education. The question is why you're so little bothered by that fact.
There is no unprecedented warming in recent years...hell, there is no warming in recent years....there is some warming since the LIA but most of the 20th century warming is an artifact of data manipulation.
Ian. You may not be smart enough to get on the right side of this argument, but you're smart enough to realize that when the sides were getting picked, the deniers got SERIOUSLY shortchanged on intellect and education. The question is why you're so little bothered by that fact.
There is no unprecedented warming in recent years...hell, there is no warming in recent years....there is some warming since the LIA but most of the 20th century warming is an artifact of data manipulation.[/QUOTE]
That is complete and utter bullshit.
Old Rocks
Diamond Member
But that is the continous Bullshit spewed by our resident idiot children, all without a single link to credible sources. And that is all that we will ever get from them.
- Thread starter
- #72
From Nature, Geoscience;
Continental-scale temperature variability during the past two millennia – Ahmed et al. (2013) “Past global climate changes had strong regional expression. To elucidate their spatio-temporal pattern, we reconstructed past temperatures for seven continental-scale regions during the past one to two millennia. The most coherent feature in nearly all of the regional temperature reconstructions is a long-term cooling trend, which ended late in the nineteenth century. At multi-decadal to centennial scales, temperature variability shows distinctly different regional patterns, with more similarity within each hemisphere than between them. There were no globally synchronous multi-decadal warm or cold intervals that define a worldwide Medieval Warm Period or Little Ice Age, but all reconstructions show generally cold conditions between ad 1580 and 1880, punctuated in some regions by warm decades during the eighteenth century. The transition to these colder conditions occurred earlier in the Arctic, Europe and Asia than in North America or the Southern Hemisphere regions. Recent warming reversed the long-term cooling; during the period ad 1971–2000, the area-weighted average reconstructed temperature was higher than any other time in nearly 1,400 years.”Moinuddin Ahmed, Kevin J. Anchukaitis, Asfawossen Asrat, Hemant P. Borgaonkar, Martina Braida, Brendan M. Buckley, Ulf Büntgen, Brian M. Chase, Duncan A. Christie, Edward R. Cook, Mark A. J. Curran, Henry F. Diaz, Jan Esper, Ze-Xin Fan, Narayan P. Gaire, Quansheng Ge, Joëlle Gergis, J Fidel González-Rouco, Hugues Goosse, Stefan W. Grab, Nicholas Graham, Rochelle Graham, Martin Grosjean, Sami T. Hanhijärvi, Darrell S. Kaufman + et al. Nature Geoscience(2013), doi:10.1038/ngeo1797.
Kaufman's original paper. this thread is about the corrections made to this paper, and the mistakes left unfixed. try to get up to speed Old Rocks.
even the uncorrected paper had many of the areas around the globe with a warmer MWP than at present
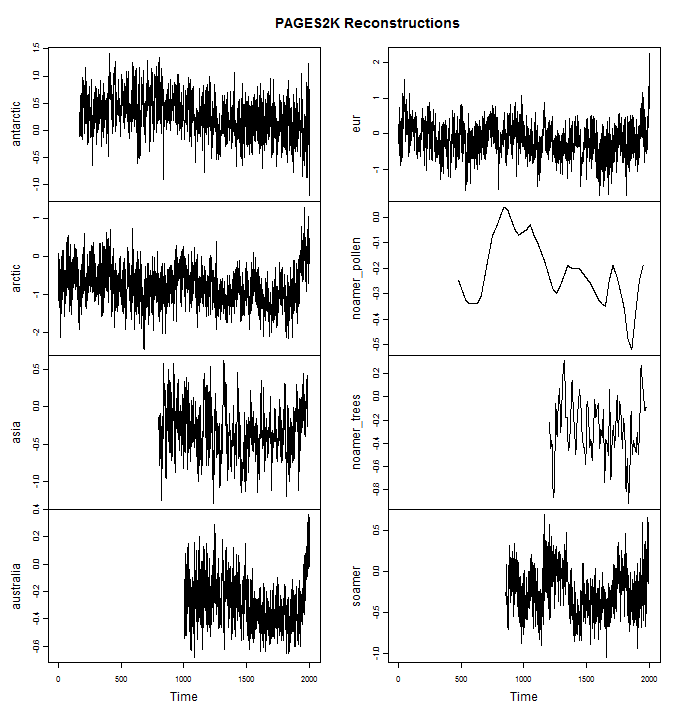
Antarctica: This is a composite of 11 isotope series (mostly d18O). It includes some new data (e.g. Steig’s new WAIS series) and some long unavailable data (Ellen Mosley-Thompson’s Plateau Remote). It shows a long-term decline with nothing exceptional in the 20th century. Steig has recently characterized the recent portion of Antarctic isotope as “unusual”, but this is really stretching the facts to the point of disinformation. I’ll post separately on this.
Arctic: This is a somewhat expanded version of the Kaufman data, unsurprising since Kaufman seems to have been the leader of the program. It shows an increase from 1800 to 1950, with leveling off since 1950. Its modern values are higher than medieval values. It is heavy on varvology (22 varve series), but, like Kaufman et al, also has ice cores (16) and tree rings (13, including Briffa’s Yamal) plus a few others. They use Korttajarvi, but Kaufman has issued one correction on this already in 2009 and avoided use of the contaminated portion. We’ve discussed Arctic d18O values from time to time, observing that their 20th century values are rather unexceptional. My surmise is that the varve data, which, as discussed in other CA threads, is highly problematic, is the main contributor to the modern-medieval differential in the PAGES reconstruction.
Asia: This reconstruction is based entirely on tree rings (229 series), all, interestingly, used in a positive orientation. 20th century values are elevated but the reconstruction lacks the distinctive blade of, for example, the Gergis stick. The majority of the tree ring data is unarchived: chronologies have been included in the PAGES2K data, but the underlying measurement remains unarchived.
Australia: this is the Gergis reconstruction. There are only two long series (both tree ring). As is well known, Gergis picked data according to ex post correlation to temperature (contrary to the representation in the disappeared article). The present network is little changed from the network in the disappeared article, with the precise differences remaining to be explained. The network is about half tree ring data and about half is short coral (nearly all O18) data. The blade in the Gergis stick comes almost entirely from coral O18 data – for which corresponding medieval information is lacking. The reconstruction is thus a sort-of splice of low-amplitude tree ring data with high amplitude coral O18. Coral specialist literature nearly always uses Sr data as a measure of temperature. The 20th century increase in coral Sr data is much less than O18 data: however, Gergis screened out the Sr data and almost exclusively used coral O18 data.
Europe: The network is 10 tree ring series and one documentary. I don’t know at present how the series were chosen. Most of the increase in the reconstruction took place prior to 1950. Late 20th century values equal and then exceed mid-century values. It will be interesting to see whether sustained ring widths will be maintained with these particular chronologies during warmer temperatures.
North America. There are two North American reconstructions. A reconstruction using pollen is at 30 year intervals and ends in 1950. It shows elevated temperatures in the late first millennium that exceed the most recent values in the series. The other reconstruction uses tree rings. It includes many series from the MBH98 dataset, including the Graybill bristlecone chronologies. Although the tree ring data is accurately dated, the reconstruction is only reported at 10-year intervals. Although the data set includes new data reaching into the present century, the reconstruction is shown only to 1974.
South America: This network is particularly hard to understand. It shows particularly low medieval values relative to the modern period – a point that is relevant to assertions on medieval-modern differential. The network also uses intrumental data. It has two long ice core series from Quelccaya, which, as previously noted, appear (according to the SI) to have been inverted, a decision which, if correct, would rather detract from conclusions about modern-medieval differential drawn from this reconstruction, given that the medieval portion of the reconstruction only has a few contributors, of which Quelccaya is prominent.
after prodding to the authors and the Journal from McIntyre, the digital corrected version of the Arctic reconstruction was released (but no one had the courtesy of notifying McIntyre, as per usual). here is the comparison between the first and corrected versions (although there are other mistakes still to be fixed)-
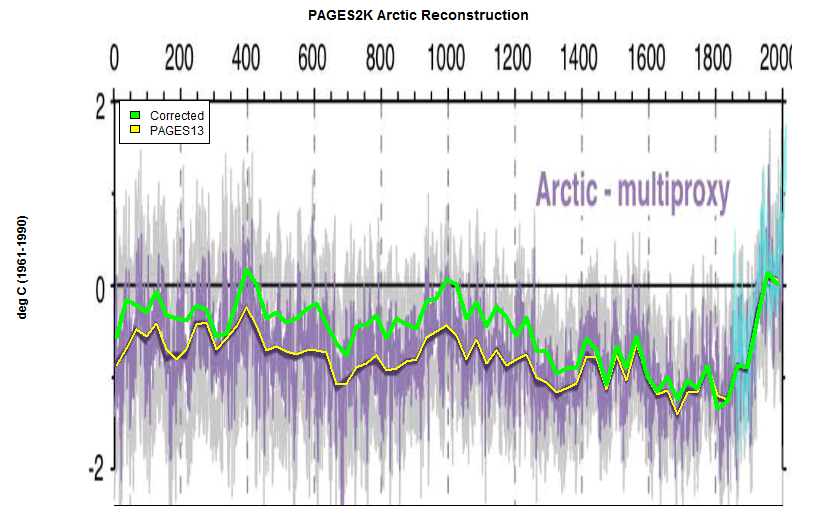
this shows both the 5th and 11th centuries as having higher average temps, although I would only call them roughly equivalent. one more kick to the nutsack of the MWP and LIA deniers.
ever notice that when mistakes are corrected, or updated proxies are included, that the results always show less of a hockeystick and more of a MWP? if the other upsidedown proxy is fixed and the much larger and inclusive new dendro proxy was used instead of the problematic Gaspe then there would be another 0.25-0.5C added to the MWP.
- Thread starter
- #74
Those points only got above zero. They did not get above current temperatures. And, of course, those are not global.
the zero is arbitrary. you can only compare proxies to other proxies, so yes the past temps are comparable to recent temps, except if instrumental data was added into the proxy data and smoothed like what was done in the flagrantly wrong MBH98,99 reconstructions.
I never said the graph named ARCTIC-Multiproxy was global. it is part of a global reconstruction which contains some areas that are hockeystick and some that are not. the Arctic was partially corrected and now shows two time periods in the past that are as warm as now. Australia is based on the flawed work of Gergis which was withdrawn. Antarctica, Asia, the two North Americas, and the South America (which is also contaminated with upsidedown proxies) graphs all show the MWP as warm or warmer than now.
that leaves leaves only Europe with no MWP. very odd, that. we have been told that the MWP was localized in Europe and we should not consider it global yet the reconstruction finds the MWP in most of the other areas EXCEPT Europe.
settled science indeed.
Why are you still ranting about the MWP? Do you believe that today's warming and the MWP have the same cause? Do you believe the MWP proves there is no greenhouse effect? Do you believe the MWP proves that humans are not responsible for the 120 ppm of CO2 added since the Industrial Revolution began? What do you believe is the significance of the MWP to the current situation?
- Thread starter
- #76
Why are you still ranting about the MWP? Do you believe that today's warming and the MWP have the same cause? Do you believe the MWP proves there is no greenhouse effect? Do you believe the MWP proves that humans are not responsible for the 120 ppm of CO2 added since the Industrial Revolution began? What do you believe is the significance of the MWP to the current situation?
ranting? have you gone back to ad homs and making strawmen again?
I have never said that mankind was not responsible for a significant portion of the CO2 increase of the last 100 years. or that that CO2 must have some impact on the radiative balance. obviously you have me confused with someone else. I would prefer you to quote my words in future, rather than make up preposterous claims.
why is the MWP important? if it was as warm, or warmer, in the past then most of the doomsday prophecies are a joke. if Old Rocks clathrates didnt let go the last time it was warm why do you think they will this time? if a degree of warming didnt turn into 3 or 6 via feedbacks last time, why will they this time?
the disappearance of the MWP was discussed early in the game, and Mann was feted for accomplishing it with the Hockeystick graph. if todays temps are within the normal range (and they are) then it would be much more difficult to drum up claims of catastrophe.
- Thread starter
- #78
Because CO2 warming, being magic warming is worse than other warming. CO2 warming is insidious....don't be fooled....just because it looks exactly like natural warming it is far worse....because it is magic.
its not magic BUT.....it can be blamed on mankind. people want to feel important, even if it is in a bad context. bad weather, losing ball team? try superstition and you are in control again.
- Thread starter
- #80
You admit that CO2 warming is real, then contend that it's superstition. Care to settle on one or the other?
I do admit that CO2 warming is real, but trivial.
I am sorry for you that you dont understand my comment about superstition. Mankind used to think that they could influence the forces of Nature by making sacrifices to the gods. now they don the mantle of 'science' rather than religion and demand that we tithe to CO2 abatement. neither accomplishes anything but the powers that be still claim we are 'doing something'. people just want to think they are in control, no matter how often it is proven that they are not.
Similar threads
- Replies
- 96
- Views
- 1K
- Replies
- 71
- Views
- 944
- Replies
- 50
- Views
- 634
- Replies
- 0
- Views
- 205
Latest Discussions
- Replies
- 10
- Views
- 165
- Replies
- 11
- Views
- 47
- Replies
- 7
- Views
- 45
- Replies
- 67
- Views
- 966
Forum List
-
-
-
-
-
Political Satire 8040
-
-
-
-
-
-
-
-
-
-
-
-
-
-
-
-
-
-
-
ObamaCare 781
-
-
-
-
-
-
-
-
-
-
-
Member Usernotes 469
-
-
-
-
-
-
-
-
-
-