Navigation
Install the app
How to install the app on iOS
Follow along with the video below to see how to install our site as a web app on your home screen.
Note: This feature may not be available in some browsers.
More options
You are using an out of date browser. It may not display this or other websites correctly.
You should upgrade or use an alternative browser.
You should upgrade or use an alternative browser.
For Crick- New Pages2k Data Paper
- Thread starter IanC
- Start date
jc456
Diamond Member
- Dec 18, 2013
- 141,616
- 30,081
- 2,180
I could care less!!I haven't forgotten that you think you're winning. You tell us repeatedly and without the slightest need or justification. It doesn't improve my opinion of you.
BTW, got that evidence to back your claim yet? Figured you didn't! WiNNiNg
I could care less!!
That's normally written "I could NOT care less", but perhaps you've got something different to say.
BTW, got that evidence to back your claim yet? Figured you didn't! WiNNiNg
You know that we do, you just choose to continue lying about it. I give you the link and you tell me you can't find it. That only tells me you have difficulty reading and comprehending material of the slightest technical nature. Helping you with that is beyond the scope of this forum and not something I feel to be my responsibility. If you don't understand, learn. If you can't understand, go to some forum where you can. Children's Toys or Pretty Pictures or Jokes for Little Ones...
Kosh
Quick Look Over There!
I haven't forgotten that you think you're winning. You tell us repeatedly and without the slightest need or justification. It doesn't improve my opinion of you.
Yes just like the far left Obama supports, the AGW cult is showing that new winning is losing!
Kosh
Quick Look Over There!
I could care less!!
That's normally written "I could NOT care less", but perhaps you've got something different to say.
BTW, got that evidence to back your claim yet? Figured you didn't! WiNNiNg
You know that we do, you just choose to continue lying about it. I give you the link and you tell me you can't find it. That only tells me you have difficulty reading and comprehending material of the slightest technical nature. Helping you with that is beyond the scope of this forum and not something I feel to be my responsibility. If you don't understand, learn. If you can't understand, go to some forum where you can. Children's Toys or Pretty Pictures or Jokes for Little Ones...
Here are some pictures that the AGW cult may understand:

Of all the carbon emitted into the atmosphere each year, 210 billion tons are from natural sources, and only 6.3 billion tons are from man's activity. Man's burning of fossil fuel, therefore only accounts for 3 percent of total emissions of CO2.

People are never told that the most powerful greenhouse gases by orders of magnitude is water vapor and clouds. When only human emitted CO2 is considered, less than one percent of the greenhouse gas potential comes from human activity. Yet, all the global warming is supposed to be attributed to it. Water vapor plays a huge role in keeping the earth warm; 70 times more powerful than the CO2 emitted by human activity. When clouds are added, CO2 becomes even less important. However, clouds not only trap heat, low elevation clouds also reflect much of the incoming solar radiation, so the sun's heat never reaches the earth's surface which cools the earth. It is this mechanism that a growing number of scientists believe is one of the primary mechanisms warming and cooling the earth.
- Thread starter
- #46
A relatively new tree ring proxy has been published that has much larger numbers than the hockeystick Gaspe proxy that has been so influential in reconstructions over the last two decades. Every new or updated proxy seems to boost the MWP and decrease modern times. Yet warmers still cling to the deficient Mann Hockeystick Graph.
jc456
Diamond Member
- Dec 18, 2013
- 141,616
- 30,081
- 2,180

hahahahaahahahahaha still LoSiNg Still no proof on record. Come on you little warmer, where's that experiment, where's that study...WiNNiNgI could care less!!
That's normally written "I could NOT care less", but perhaps you've got something different to say.
BTW, got that evidence to back your claim yet? Figured you didn't! WiNNiNg
You know that we do, you just choose to continue lying about it. I give you the link and you tell me you can't find it. That only tells me you have difficulty reading and comprehending material of the slightest technical nature. Helping you with that is beyond the scope of this forum and not something I feel to be my responsibility. If you don't understand, learn. If you can't understand, go to some forum where you can. Children's Toys or Pretty Pictures or Jokes for Little Ones...
warmer, where's that experiment, where's that study.
Right were you last saw them, liar.
Kosh
Quick Look Over There!
warmer, where's that experiment, where's that study.
Right were you last saw them, liar.
Now that is rich to watch this AGW cult member call anyone here a liar..
jc456
Diamond Member
- Dec 18, 2013
- 141,616
- 30,081
- 2,180
Continued WiNNiNgwarmer, where's that experiment, where's that study.
Right were you last saw them, liar.


Old Rocks
Diamond Member
A relatively new tree ring proxy has been published that has much larger numbers than the hockeystick Gaspe proxy that has been so influential in reconstructions over the last two decades. Every new or updated proxy seems to boost the MWP and decrease modern times. Yet warmers still cling to the deficient Mann Hockeystick Graph.
Really? That is certainly not what I have seen in peer reviewed literature.
NOAA Paleoclimatology Global Warming - The Data
| Medieval Warm Period - 9th to 13th Centuries Norse seafaring and colonization around the North Atlantic at the end of the 9th century indicated that regional North Atlantic climate was warmer during medieval times than during the cooler "Little Ice Age" of the 15th - 19thcenturies. As paleoclimatic records have become more numerous, it has become apparent that "Medieval Warm Period" or "Medieval Optimum" temperatures were warmer over the Northern Hemisphere than during the subsequent "Little Ice Age", and also comparable to temperatures during the early 20th century. The regional patterns and the magnitude of this warmth remain an area of active research because the data become sparse going back in time prior to the last four centuries. The plot below, from the Intergovernmental Panel on Climate Change Fourth Assessment Report (2007), shows numerous Northern Hemisphere paleoclimatic temperature reconstructions. The various studies differ in methodology, and in the underlying paleoclimate proxy data utilized, but all reconstruct the same basic pattern of cool "Little Ice Age", warmer "Medieval Warm Period", and still warmer late 20th and 21st century temperatures. |
 In summary, it appears that the late 20th and early 21st centuries are likely the warmest period the Earth has seen in at least 1200 years. For a summary of the latest available research on the nature of climate during the "Medieval Warm Period", please see Box 6.4 of the IPCC 2007 Palaeoclimate chapter. To learn more about the "Medieval Warm Period", please read this review published in Climatic Change, written by M.K. Hughes and H.F. Diaz. (Click here for complete review reference). Discussion of the last 2,000 years, including the Medieval Warm Period, and regional patterns and uncertainties, appears in the National Research Council Report titled "Surface Temperature Reconstructions for the Last 2,000 Years", available from the National Academy Press. |
Old Rocks
Diamond Member
From Nature, Geoscience;
Continental-scale temperature variability during the past two millennia – Ahmed et al. (2013) “Past global climate changes had strong regional expression. To elucidate their spatio-temporal pattern, we reconstructed past temperatures for seven continental-scale regions during the past one to two millennia. The most coherent feature in nearly all of the regional temperature reconstructions is a long-term cooling trend, which ended late in the nineteenth century. At multi-decadal to centennial scales, temperature variability shows distinctly different regional patterns, with more similarity within each hemisphere than between them. There were no globally synchronous multi-decadal warm or cold intervals that define a worldwide Medieval Warm Period or Little Ice Age, but all reconstructions show generally cold conditions between ad 1580 and 1880, punctuated in some regions by warm decades during the eighteenth century. The transition to these colder conditions occurred earlier in the Arctic, Europe and Asia than in North America or the Southern Hemisphere regions. Recent warming reversed the long-term cooling; during the period ad 1971–2000, the area-weighted average reconstructed temperature was higher than any other time in nearly 1,400 years.”Moinuddin Ahmed, Kevin J. Anchukaitis, Asfawossen Asrat, Hemant P. Borgaonkar, Martina Braida, Brendan M. Buckley, Ulf Büntgen, Brian M. Chase, Duncan A. Christie, Edward R. Cook, Mark A. J. Curran, Henry F. Diaz, Jan Esper, Ze-Xin Fan, Narayan P. Gaire, Quansheng Ge, Joëlle Gergis, J Fidel González-Rouco, Hugues Goosse, Stefan W. Grab, Nicholas Graham, Rochelle Graham, Martin Grosjean, Sami T. Hanhijärvi, Darrell S. Kaufman + et al. Nature Geoscience(2013), doi:10.1038/ngeo1797.
Continental-scale temperature variability during the past two millennia – Ahmed et al. (2013) “Past global climate changes had strong regional expression. To elucidate their spatio-temporal pattern, we reconstructed past temperatures for seven continental-scale regions during the past one to two millennia. The most coherent feature in nearly all of the regional temperature reconstructions is a long-term cooling trend, which ended late in the nineteenth century. At multi-decadal to centennial scales, temperature variability shows distinctly different regional patterns, with more similarity within each hemisphere than between them. There were no globally synchronous multi-decadal warm or cold intervals that define a worldwide Medieval Warm Period or Little Ice Age, but all reconstructions show generally cold conditions between ad 1580 and 1880, punctuated in some regions by warm decades during the eighteenth century. The transition to these colder conditions occurred earlier in the Arctic, Europe and Asia than in North America or the Southern Hemisphere regions. Recent warming reversed the long-term cooling; during the period ad 1971–2000, the area-weighted average reconstructed temperature was higher than any other time in nearly 1,400 years.”Moinuddin Ahmed, Kevin J. Anchukaitis, Asfawossen Asrat, Hemant P. Borgaonkar, Martina Braida, Brendan M. Buckley, Ulf Büntgen, Brian M. Chase, Duncan A. Christie, Edward R. Cook, Mark A. J. Curran, Henry F. Diaz, Jan Esper, Ze-Xin Fan, Narayan P. Gaire, Quansheng Ge, Joëlle Gergis, J Fidel González-Rouco, Hugues Goosse, Stefan W. Grab, Nicholas Graham, Rochelle Graham, Martin Grosjean, Sami T. Hanhijärvi, Darrell S. Kaufman + et al. Nature Geoscience(2013), doi:10.1038/ngeo1797.
Old Rocks
Diamond Member
And many more like this at this site;
Papers on the MWP as Global Event AGW Observer
Extensive glaciers in northwest North America during Medieval time – Koch & Clague (2011) “The Medieval Warm Period is an interval of purportedly warm climate during the early part of the past millennium. The duration, areal extent, and even existence of the Medieval Warm Period have been debated; in some areas the climate of this interval appears to have been affected more by changes in precipitation than in temperature. Here, we provide new evidence showing that several glaciers in western North America advanced during Medieval time and that some glaciers achieved extents similar to those at the peak of the Little Ice Age, many hundred years later. The advances cannot be reconciled with a climate similar to that of the twentieth century, which has been argued to be an analog, and likely were the result of increased winter precipitation due to prolonged La Niña-like conditions that, in turn, may be linked to elevated solar activity. Changes in solar output may initiate a response in the tropical Pacific that directly impacts the El Niño/Southern Oscillation and associated North Pacific teleconnections.” Johannes Koch and John J. Clague, Climatic Change, Volume 107, Numbers 3-4, 593-613, DOI: 10.1007/s10584-010-0016-2.
Old Rocks
Diamond Member
You see, we present articles from real scientists, you fellows present flap-yap, and spews from freaks like Watts and a fake British Lord.
- Thread starter
- #56
A relatively new tree ring proxy has been published that has much larger numbers than the hockeystick Gaspe proxy that has been so influential in reconstructions over the last two decades. Every new or updated proxy seems to boost the MWP and decrease modern times. Yet warmers still cling to the deficient Mann Hockeystick Graph.
Really? That is certainly not what I have seen in peer reviewed literature.
NOAA Paleoclimatology Global Warming - The Data
[TBODY] [/TBODY]
Medieval Warm Period - 9th to 13th Centuries
Norse seafaring and colonization around the North Atlantic at the end of the 9th century indicated that regional North Atlantic climate was warmer during medieval times than during the cooler "Little Ice Age" of the 15th - 19thcenturies. As paleoclimatic records have become more numerous, it has become apparent that "Medieval Warm Period" or "Medieval Optimum" temperatures were warmer over the Northern Hemisphere than during the subsequent "Little Ice Age", and also comparable to temperatures during the early 20th century. The regional patterns and the magnitude of this warmth remain an area of active research because the data become sparse going back in time prior to the last four centuries.
The plot below, from the Intergovernmental Panel on Climate Change Fourth Assessment Report (2007), shows numerous Northern Hemisphere paleoclimatic temperature reconstructions. The various studies differ in methodology, and in the underlying paleoclimate proxy data utilized, but all reconstruct the same basic pattern of cool "Little Ice Age", warmer "Medieval Warm Period", and still warmer late 20th and 21st century temperatures.
In summary, it appears that the late 20th and early 21st centuries are likely the warmest period the Earth has seen in at least 1200 years. For a summary of the latest available research on the nature of climate during the "Medieval Warm Period", please see Box 6.4 of the IPCC 2007 Palaeoclimate chapter. To learn more about the "Medieval Warm Period", please read this review published in Climatic Change, written by M.K. Hughes and H.F. Diaz. (Click here for complete review reference). Discussion of the last 2,000 years, including the Medieval Warm Period, and regional patterns and uncertainties, appears in the National Research Council Report titled "Surface Temperature Reconstructions for the Last 2,000 Years", available from the National Academy Press.
Really, Old Rocks? the spaghetti graph from AR4 that uses multiple reconstructions that all use at least some combination of the tainted proxies that are known to have an artificial hockeystick shape. why do you think I was complaining about the Gaspe proxy? its fingerprint is all over that graph.
- Thread starter
- #57
And many more like this at this site;
Papers on the MWP as Global Event AGW Observer
Extensive glaciers in northwest North America during Medieval time – Koch & Clague (2011) “The Medieval Warm Period is an interval of purportedly warm climate during the early part of the past millennium. The duration, areal extent, and even existence of the Medieval Warm Period have been debated; in some areas the climate of this interval appears to have been affected more by changes in precipitation than in temperature. Here, we provide new evidence showing that several glaciers in western North America advanced during Medieval time and that some glaciers achieved extents similar to those at the peak of the Little Ice Age, many hundred years later. The advances cannot be reconciled with a climate similar to that of the twentieth century, which has been argued to be an analog, and likely were the result of increased winter precipitation due to prolonged La Niña-like conditions that, in turn, may be linked to elevated solar activity. Changes in solar output may initiate a response in the tropical Pacific that directly impacts the El Niño/Southern Oscillation and associated North Pacific teleconnections.” Johannes Koch and John J. Clague, Climatic Change, Volume 107, Numbers 3-4, 593-613, DOI: 10.1007/s10584-010-0016-2.
a blog article from 2009 giving links to papers supporting a certain position on the MWP. I dont have a problem with that but I think it is hilarious that the last update is to the original version of PAGES2K.
which leads to.......
- Thread starter
- #58
From Nature, Geoscience;
Continental-scale temperature variability during the past two millennia – Ahmed et al. (2013) “Past global climate changes had strong regional expression. To elucidate their spatio-temporal pattern, we reconstructed past temperatures for seven continental-scale regions during the past one to two millennia. The most coherent feature in nearly all of the regional temperature reconstructions is a long-term cooling trend, which ended late in the nineteenth century. At multi-decadal to centennial scales, temperature variability shows distinctly different regional patterns, with more similarity within each hemisphere than between them. There were no globally synchronous multi-decadal warm or cold intervals that define a worldwide Medieval Warm Period or Little Ice Age, but all reconstructions show generally cold conditions between ad 1580 and 1880, punctuated in some regions by warm decades during the eighteenth century. The transition to these colder conditions occurred earlier in the Arctic, Europe and Asia than in North America or the Southern Hemisphere regions. Recent warming reversed the long-term cooling; during the period ad 1971–2000, the area-weighted average reconstructed temperature was higher than any other time in nearly 1,400 years.”Moinuddin Ahmed, Kevin J. Anchukaitis, Asfawossen Asrat, Hemant P. Borgaonkar, Martina Braida, Brendan M. Buckley, Ulf Büntgen, Brian M. Chase, Duncan A. Christie, Edward R. Cook, Mark A. J. Curran, Henry F. Diaz, Jan Esper, Ze-Xin Fan, Narayan P. Gaire, Quansheng Ge, Joëlle Gergis, J Fidel González-Rouco, Hugues Goosse, Stefan W. Grab, Nicholas Graham, Rochelle Graham, Martin Grosjean, Sami T. Hanhijärvi, Darrell S. Kaufman + et al. Nature Geoscience(2013), doi:10.1038/ngeo1797.
Kaufman's original paper. this thread is about the corrections made to this paper, and the mistakes left unfixed. try to get up to speed Old Rocks.
even the uncorrected paper had many of the areas around the globe with a warmer MWP than at present
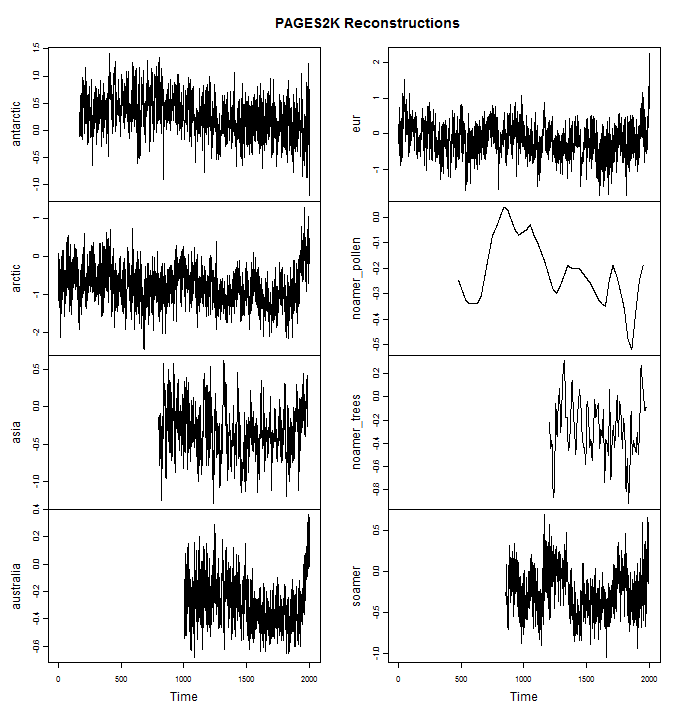
Antarctica: This is a composite of 11 isotope series (mostly d18O). It includes some new data (e.g. Steig’s new WAIS series) and some long unavailable data (Ellen Mosley-Thompson’s Plateau Remote). It shows a long-term decline with nothing exceptional in the 20th century. Steig has recently characterized the recent portion of Antarctic isotope as “unusual”, but this is really stretching the facts to the point of disinformation. I’ll post separately on this.
Arctic: This is a somewhat expanded version of the Kaufman data, unsurprising since Kaufman seems to have been the leader of the program. It shows an increase from 1800 to 1950, with leveling off since 1950. Its modern values are higher than medieval values. It is heavy on varvology (22 varve series), but, like Kaufman et al, also has ice cores (16) and tree rings (13, including Briffa’s Yamal) plus a few others. They use Korttajarvi, but Kaufman has issued one correction on this already in 2009 and avoided use of the contaminated portion. We’ve discussed Arctic d18O values from time to time, observing that their 20th century values are rather unexceptional. My surmise is that the varve data, which, as discussed in other CA threads, is highly problematic, is the main contributor to the modern-medieval differential in the PAGES reconstruction.
Asia: This reconstruction is based entirely on tree rings (229 series), all, interestingly, used in a positive orientation. 20th century values are elevated but the reconstruction lacks the distinctive blade of, for example, the Gergis stick. The majority of the tree ring data is unarchived: chronologies have been included in the PAGES2K data, but the underlying measurement remains unarchived.
Australia: this is the Gergis reconstruction. There are only two long series (both tree ring). As is well known, Gergis picked data according to ex post correlation to temperature (contrary to the representation in the disappeared article). The present network is little changed from the network in the disappeared article, with the precise differences remaining to be explained. The network is about half tree ring data and about half is short coral (nearly all O18) data. The blade in the Gergis stick comes almost entirely from coral O18 data – for which corresponding medieval information is lacking. The reconstruction is thus a sort-of splice of low-amplitude tree ring data with high amplitude coral O18. Coral specialist literature nearly always uses Sr data as a measure of temperature. The 20th century increase in coral Sr data is much less than O18 data: however, Gergis screened out the Sr data and almost exclusively used coral O18 data.
Europe: The network is 10 tree ring series and one documentary. I don’t know at present how the series were chosen. Most of the increase in the reconstruction took place prior to 1950. Late 20th century values equal and then exceed mid-century values. It will be interesting to see whether sustained ring widths will be maintained with these particular chronologies during warmer temperatures.
North America. There are two North American reconstructions. A reconstruction using pollen is at 30 year intervals and ends in 1950. It shows elevated temperatures in the late first millennium that exceed the most recent values in the series. The other reconstruction uses tree rings. It includes many series from the MBH98 dataset, including the Graybill bristlecone chronologies. Although the tree ring data is accurately dated, the reconstruction is only reported at 10-year intervals. Although the data set includes new data reaching into the present century, the reconstruction is shown only to 1974.
South America: This network is particularly hard to understand. It shows particularly low medieval values relative to the modern period – a point that is relevant to assertions on medieval-modern differential. The network also uses intrumental data. It has two long ice core series from Quelccaya, which, as previously noted, appear (according to the SI) to have been inverted, a decision which, if correct, would rather detract from conclusions about modern-medieval differential drawn from this reconstruction, given that the medieval portion of the reconstruction only has a few contributors, of which Quelccaya is prominent.
- Thread starter
- #59
and BTW.....
yes, THAT Gergis paper. the one that was accepted and published online only to be withdrawn before the paper edition came out.
Australia: this is the Gergis reconstruction. There are only two long series (both tree ring). As is well known, Gergis picked data according to ex post correlation to temperature (contrary to the representation in the disappeared article). The present network is little changed from the network in the disappeared article, with the precise differences remaining to be explained. The network is about half tree ring data and about half is short coral (nearly all O18) data. The blade in the Gergis stick comes almost entirely from coral O18 data – for which corresponding medieval information is lacking. The reconstruction is thus a sort-of splice of low-amplitude tree ring data with high amplitude coral O18. Coral specialist literature nearly always uses Sr data as a measure of temperature. The 20th century increase in coral Sr data is much less than O18 data: however, Gergis screened out the Sr data and almost exclusively used coral O18 data.
yes, THAT Gergis paper. the one that was accepted and published online only to be withdrawn before the paper edition came out.
If you're trying to tell us the world hasn't experienced significant warming, unprecedented in several millennia, you put up the wrong graphs.
Similar threads
- Replies
- 72
- Views
- 1K
- Replies
- 20
- Views
- 189
- Replies
- 2
- Views
- 82
Latest Discussions
- Replies
- 230
- Views
- 2K
- Replies
- 67
- Views
- 464
Forum List
-
-
-
-
-
Political Satire 8885
-
-
-
-
-
-
-
-
-
-
-
-
-
-
-
-
-
-
-
ObamaCare 781
-
-
-
-
-
-
-
-
-
-
-
Member Usernotes 492
-
-
-
-
-
-
-
-
-
-