Economy Adds 163,000 Jobs, but UE ticks up to 8.3%

It's amazing that Romney isn't ahead by double digits.

'Real' Unemployment Rate Shows Far More Jobless


While the national unemployment rate paints a grim picture, a look at individual states and their so-called real jobless rates becomes even more troubling.

The government's most widely publicized unemployment rate measures only those who are out of a job and currently looking for work. It does not count discouraged potential employees who have quit looking, nor those who are underemployed — wanting to work full-time but forced to work part-time.

For that count, the government releases a separate number called the "U-6," which provides a more complete tally of how many people really are out of work.

The numbers in some cases are startling.

Consider: Nevada's U-6 rate is 22.1 percent, up from just 7.6 percent in 2007. Economically troubled California has a 20.3 percent real rate, while Rhode Island is at 18.3 percent, more than double its 8.3 percent rate in 2007.
'Real' Unemployment Rate Shows Far More Jobless - US Business News - CNBC
 
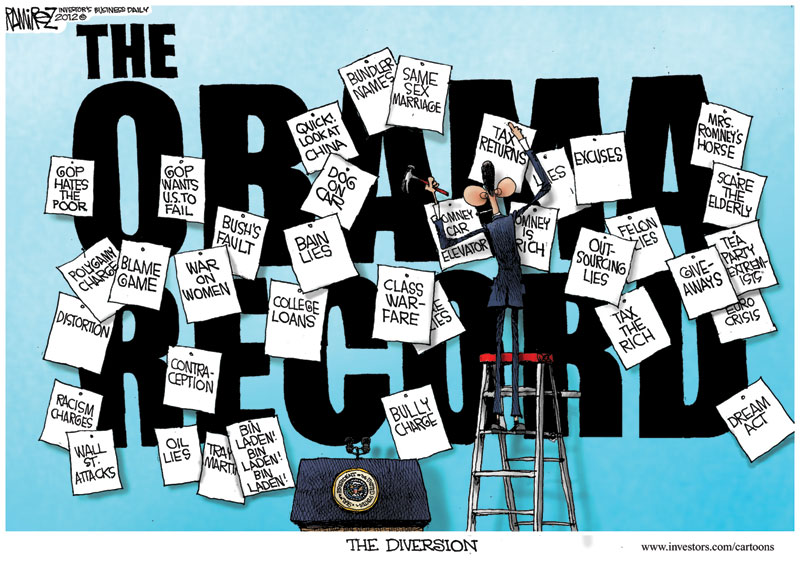
Anything to distract from the fail that is Obama....

diversions.jpg
 
[If a gander be the male goose, what's the female goose referred to as? We can use that term for our metro sexual president, yano, the one that was pictured, with helmet, on the bicycle. I think the law firm that suggested Atty Mirengoff retire because of political correctness made a serious mistake freeing him to concentrate on his Conservative blogging]

"POSTED ON AUGUST 2, 2012 BY PAUL MIRENGOFF IN 2012 PRESIDENTIAL ELECTION
“BREAD AND PEACE” MODEL PREDICTS SIZEABLE DEFEAT FOR OBAMA
In my view, presidential elections are usually pretty easy to predict. You just look at how the economy is doing. When we’re at war or in a major foreign policy crisis, you factor that in. But an incumbent president has to be judged very harshly over his handling of the war or foreign crisis before he will lose in a good economy.

It turns out that there’s a predictive model that formulizes these intuitions. It’s called the Bread and Peace Model. Douglas Hibbs, a retired economics and politics professor, developed it. According to Hibbs, the model nicely explains nearly every post-World War II presidential elections. Only 1996 (when Clinton overperformed) and 2000 (when Gore underperformed) are problematic.

I doubt, though, that Americans will hold Afghanistan fatalities against Obama. For one thing, he’s pulling out. For another, Mitt Romeny is slightly more hawkish on Afghanistan than the president.

I wouldn’t be surprised if the Bread side of Hibbs’ formula standing alone, correctly predicts this year’s race. If so, the election will be closer than Hibbs’ model predicts, but with Romney still winning the popular vote.

For the Peace side, Hibbs basically counts American fatalities, subject to a proviso discussed below. For the Bread side, he relies on growth of per capita real disposable personal income.

Under Hibbs’ model, President Obama will likely receive only 47.2 to 47.8 of the popular vote. In other words, Romney’s margin will approach the margin that Obama won by four years ago.

In my view, the “Peace” component of Hibbs’ model is working against Obama more strongly than it should. Hibbs stiplulates that he does not count deaths caused in a president’s first term by a war initiated in a previous administration. Thus, Hibbs doesn’t count American fatalities in Iraq against Obama. He does, however, count those in Afghanistan, since Obama implemented a new stepped-up campaign there."

“Bread and peace” model predicts sizeable defeat for Obama | Power Line
 
It's amazing that Romney isn't ahead by double digits.

'Real' Unemployment Rate Shows Far More Jobless


While the national unemployment rate paints a grim picture, a look at individual states and their so-called real jobless rates becomes even more troubling.

The government's most widely publicized unemployment rate measures only those who are out of a job and currently looking for work. It does not count discouraged potential employees who have quit looking, nor those who are underemployed — wanting to work full-time but forced to work part-time.

For that count, the government releases a separate number called the "U-6," which provides a more complete tally of how many people really are out of work.

The numbers in some cases are startling.

Consider: Nevada's U-6 rate is 22.1 percent, up from just 7.6 percent in 2007. Economically troubled California has a 20.3 percent real rate, while Rhode Island is at 18.3 percent, more than double its 8.3 percent rate in 2007.

'Real' Unemployment Rate Shows Far More Jobless - US Business News - CNBC

He is. The palace guards in the Obama media are fluffing the numbers with polls that skew +19 D ...anything to keep the illusion alive.
 
Letz do summa that thar non-chillunz leff behine maff.
How many working aged adults are there in The Nation Formerly Known as USA ? These would be murkins ranging from 16 to 65.
How many murkins are on the unemployment charts ?
How many murkinz are self employed ?
How many murkins are on Socialist Suckyeritty "disability"
Find an oriental to run them that nuberz and you'll have a somewhat accurate unemployment rate.
Much more accurate than what your masters have their whores report to you.
Lets figure in The Meatheads walking aimlessly on bases planet wide while we're at it.After all, if it wasn't for their "service" they'd be unemployed too.
 
I'm not surprised with the economic news. My business seems to lead the indicators. August is looking to be the same or slightly worse than July for those who want a heads up.
 
I'd like to see the link that told you unemployment went up because people dropped out.

Thanks.

It's fuzzy math.

No actually, its not

Employment Situation Summary
Table A-10. Selected unemployment indicators, seasonally adjusted
Unemployment doesn't go up when people drop out of the labor force. That's perfectly backwards.

Unemployment goes up as people either re-enter the labor force but are unable to find work OR the number of people in the labor force remains the same but the number employed goes down. Your problem is that you don't understand the link that you, yourself provided.
 
Though seasonally adjusted, I'm wondering if businesses are eyeing the election and deferring until that is settled?

The Fed and White House has made it pretty clear we can expect pretty much what we have until late 2013 or early 2014. For business to change would require a Romney win.
 
According to the report, unemployment didn't go up. It was at 8.3% in June and 8.3% for July.
 
Meanwhile......

– The number of Americans on disability has risen 19% faster than jobs created during this recovery.
– In the 1960s, there were 18 workers per Medicaid recipient. Today that number is 2.5.
_ Food Stamp enrollment has increased 160% since 2000.
 
A "jump" tends to indicate some dramatic change to me.

4% unemployment used to be considered a frictional rate which was normal. Now it is supposedly 8%. That is a doubling of the rate. I can't see how this is anything other than failed government policy. We need a change in policy.
 
Unemployment doesn't go up when people drop out of the labor force. That's perfectly backwards.

Unemployment goes up as people either re-enter the labor force but are unable to find work OR the number of people in the labor force remains the same but the number employed goes down. Your problem is that you don't understand the link that you, yourself provided.

I'm just trying to figure out why they think someone who stops looking for work because they went back to school, retired or are focusing on family, that somehow that's a bad thing.
 

Forum List

Back
Top